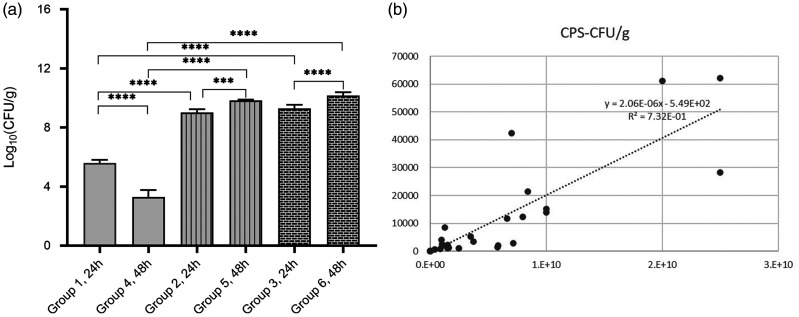
Figure 3.
Bacterial loads in the right lungs post-infection (n = 6 mice per group). (a) Bacterial loads (colony forming units [CFU]/g) in the right lungs of infected mice. Data presented as mean ± SD. ***P < 0.001, ****P < 0.0001; one-way analysis of variance followed by Dunnett’s test for group comparisons. (b) The semi-quantitative counts per second (cps) values representing bioluminescent intensity and bacterial lung loads levels were closely related.

