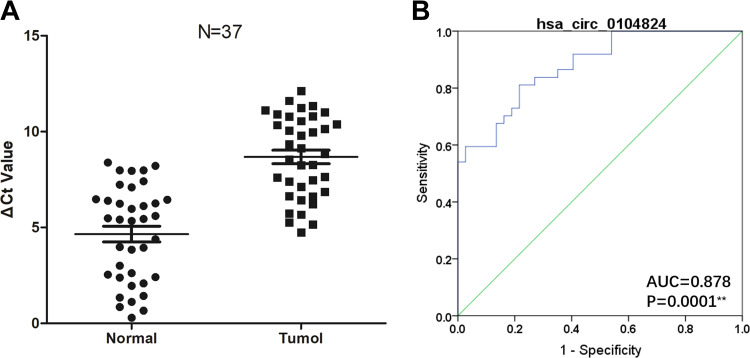
Figure 4.
Hsa_circ_0104824 is a diagnostic ability in breast cancer. Breast cancer tissue and paracancerous tissues, n = 37; (A) expression level of hsa_circ_0104824 quantified by qPCR; (B) ROC analysis of hsa_circ_0104824, AUC values are given on the graph; * P <0.05, ** P <0.01. CT indicates cycle threshold. Scatter plot drawing with △CT value between CRC and adjacent tissues in Graphpad Software.

