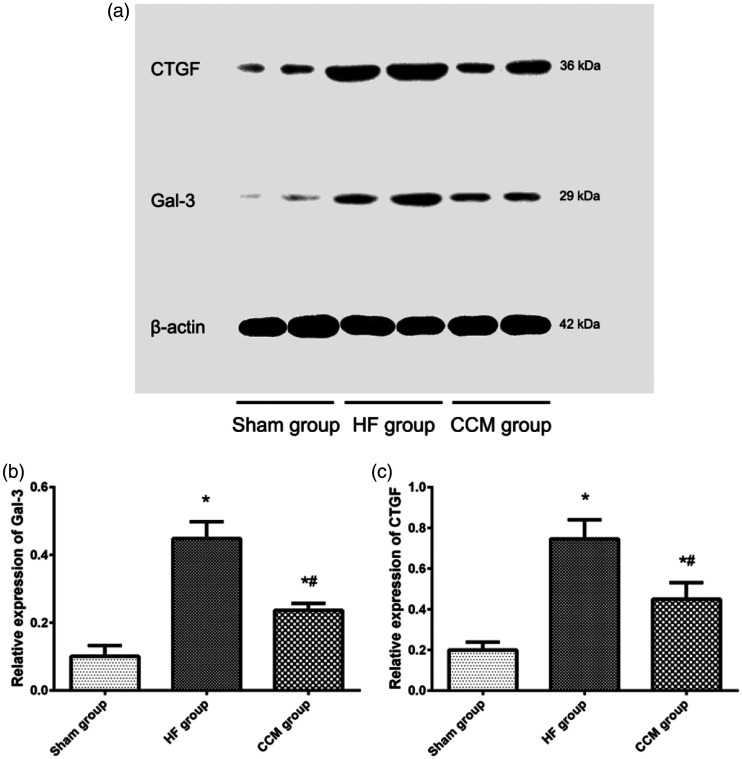
Figure 5.
CTGF and Gal-3 protein levels in the myocardium. (a) Representative blots showing CTGF and Gal-3 protein levels. (b) Comparison of Gal-3 protein levels among the three groups. (c) Comparison of CTGF protein levels among the three groups. Each bar represents the mean ± standard deviation. *P < 0.05 vs. the sham group (n = 5); #P < 0.05 vs. the HF group (n = 5).
Gal-3, galectin-3; HF, heart failure; CCM, cardiac contractility modulation; CTGF, connective tissue growth factor.

