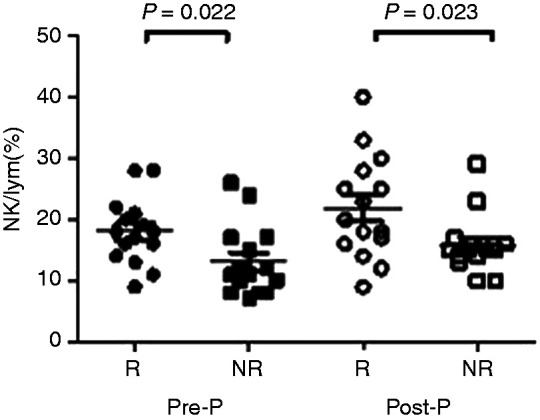
Figure 4.

Comparison of NK cells in the R group and age-, sex- and treatment course–matched NR group during PEG-IFN treatment. Comparison of NK cell levels between those who achieved HBsAg seroconversion after 48 wk of treatment (R group; n = 15) and those who failed to achieve HBsAg seroconversion (NR group; n = 15) at the time point before HBsAg seroconversion was detected (Pre-P) and at the time point when seroconversion of HBsAg was detected (Post-P) after matching for age, sex and course of treatment.
