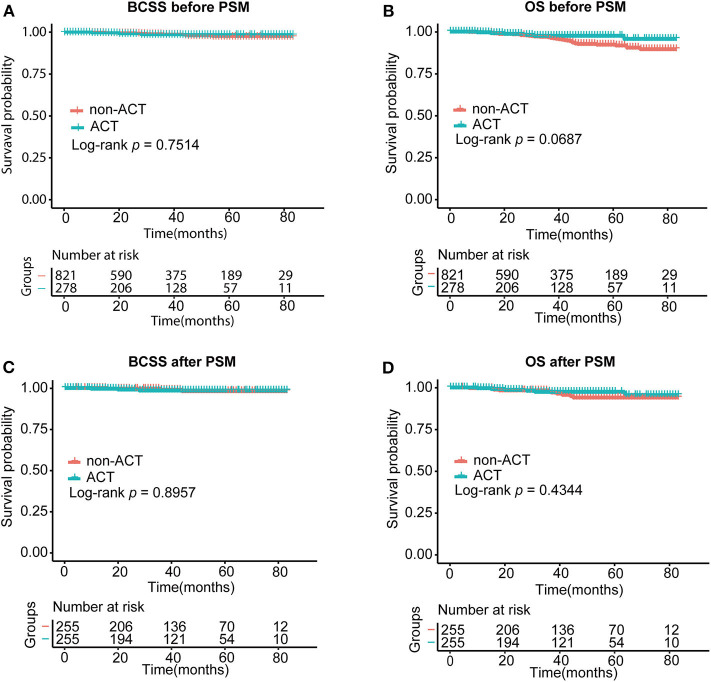
Figure 2.
Survival curves of the two groups of patients with BCSS (A) and OS (B) before PSM and BCSS (C) and OS (D) after PSM. ACT, adjuvant chemotherapy; BCSS, breast cancer–specific survival; OS, overall survival. The log-rank test was performed to compare the BCSS and OS rates of the two group patients.

