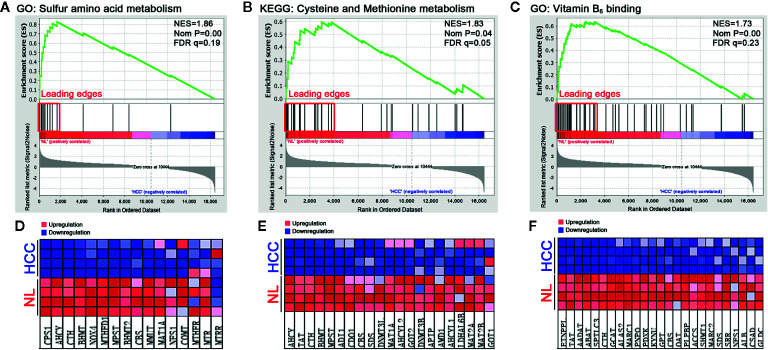
Figure 1.
Functional enrichment analysis of genesets in HCC tumor tissues. A microarray dataset (GSE102081) of HCC tumor tissues and normal liver (NL) tissues was analyzed using the GSEA tool. (A–C) The enrichment indexes of three genesets are shown in (A) (sulfur amino acid metabolism), (B) (cysteine and methionine metabolism), and (C) (vitamin B6 binding activity), respectively. The genesets were considered to be significantly enriched at NES (normalized enrichment score) >1, Nom P (nominal p-value) <0.05, and FDR q-value <0.25. (D–F) Heatmaps of the enriched genes in (A–C) were created to display their relative expression.

