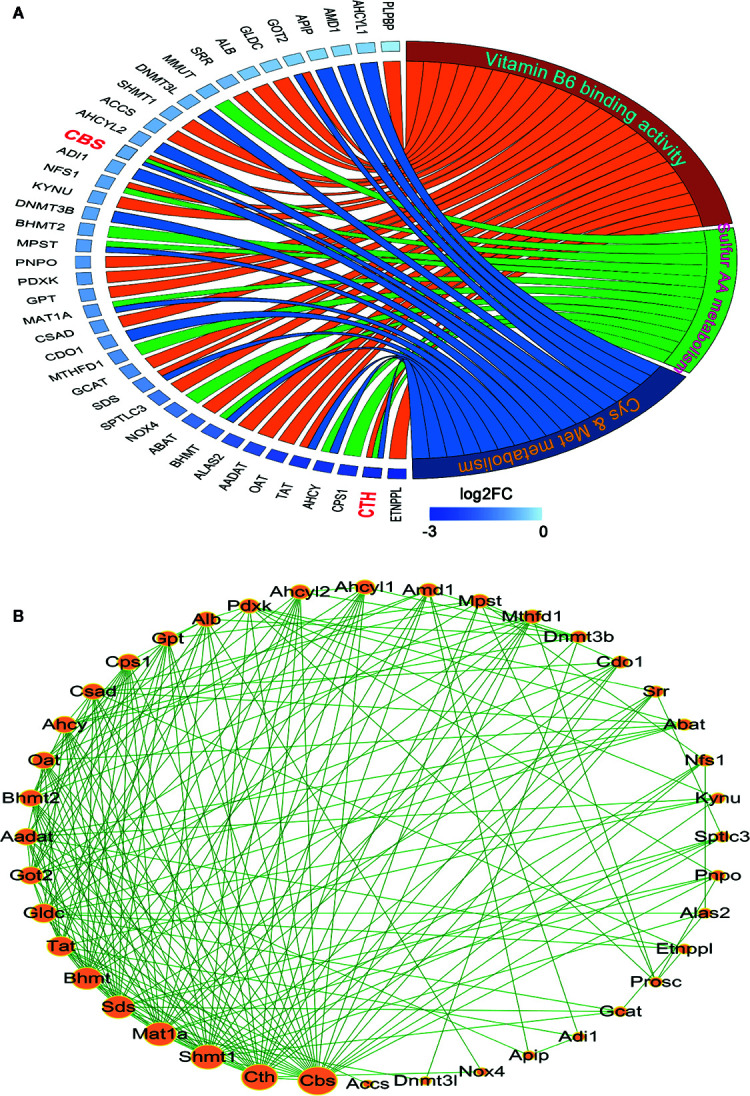
Figure 2.

Analysis of the interaction among the leading-edge genes. (A) The ownership and relative expression of the leading-edge genes from three genesets (sulfur amino acid metabolism GO set, cysteine and methionine metabolism KEGG set, and vitamin B6 binding activity GO set) were presented through a chord diagram, which was drawn using the GOPlot R package. (B) The interaction of the genes was analyzed with the STRING online tool. The PPI network was constructed and the interaction degrees were calculated with Cytoscape 3.7 software.
