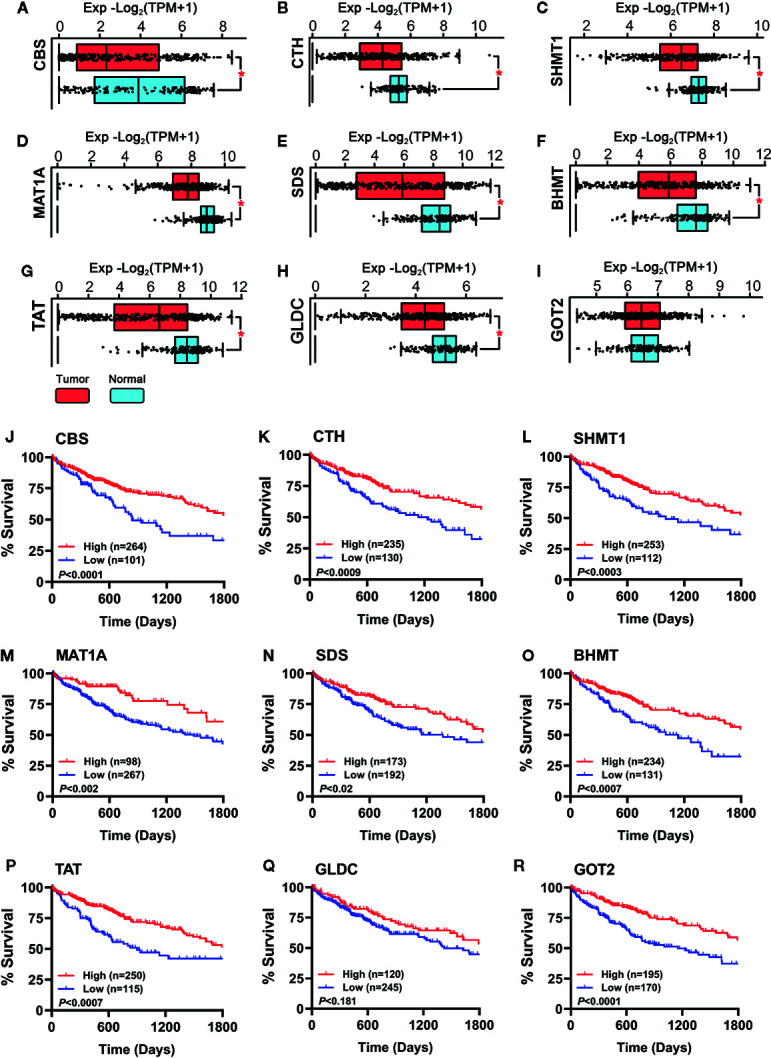
Figure 3.

(A–I) Expression of the hub genes between 160 normal liver tissues (50 samples of TCGA_LIHC cohort and 110 samples in GTEx dataset) and 368 HCC tumor tissues of TCGA_LIHC cohort were observed. Data are shown as median ± quartile, *P < 0.001 vs. Normal liver tissues. (J–R) Analysis of the survival rate of HCC patients in TCGA_LIHC database between high expression (red lines) and low expression (blue lines) of the hub genes. The number of patients in either group and the Log-rank test’s P are shown in each panel.
