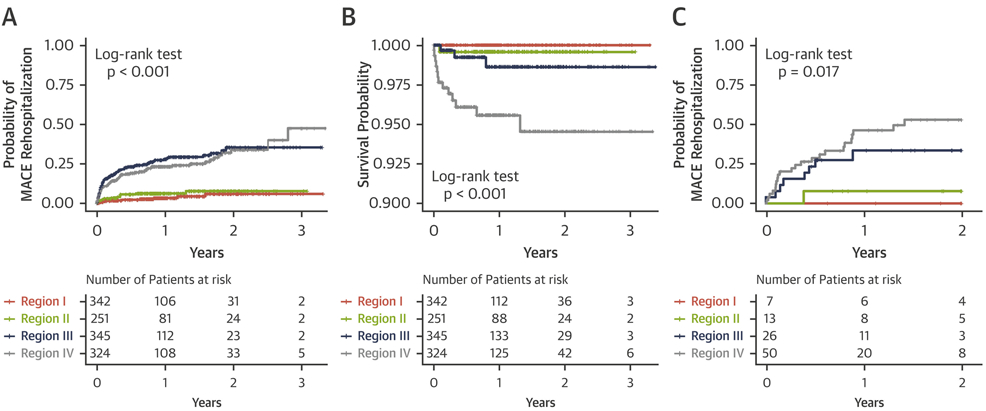
FIGURE 4. Kaplan-Meier Curve for MACE-Related Outcomes by TDA Regions.

KapLan-Meier curves of the 4 regions: (A) major adverse cardiovascular event(s) (MACE)-related rehospitalization in the primary cohort, (B) MACE-related death in the primary cohort, and (C) MACE-related rehospitalization in the secondary cohort. Abbreviation as in Figure 1.
