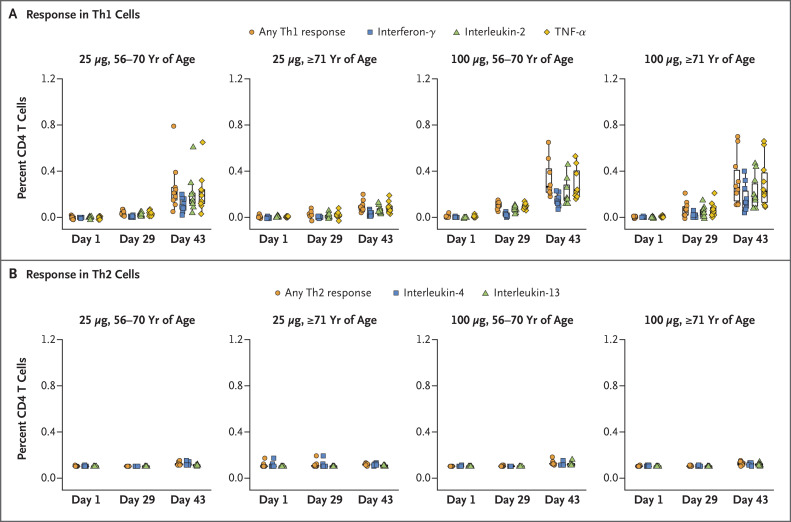
Figure 3. CD4 T-Cell Responses to the S1 Peptide Pool after Receipt of mRNA-1273.
Shown are the percentages of CD4 T cells that produced the indicated cytokines in the two age subgroups (56 to 70 years or ≥71 years) after stimulation with the SARS-CoV-2 S1 peptide pool. Type 1 helper T (Th1) cells are shown in Panel A, and type 2 helper T (Th2) cells are shown in Panel B. A total of 40 participants who were enrolled in the study (10 participants in each of the two age and dose subgroups) were tested at each time point, except for 1 participant who was between the ages of 56 and 70 years and who did not receive the second 25-μg dose and so did not contribute data after day 29. In Panel A, the boxes indicate interquartile ranges. Details regarding the T-cell calculations are provided in the Supplementary Appendix. TNF-α denotes tumor necrosis factor α.

