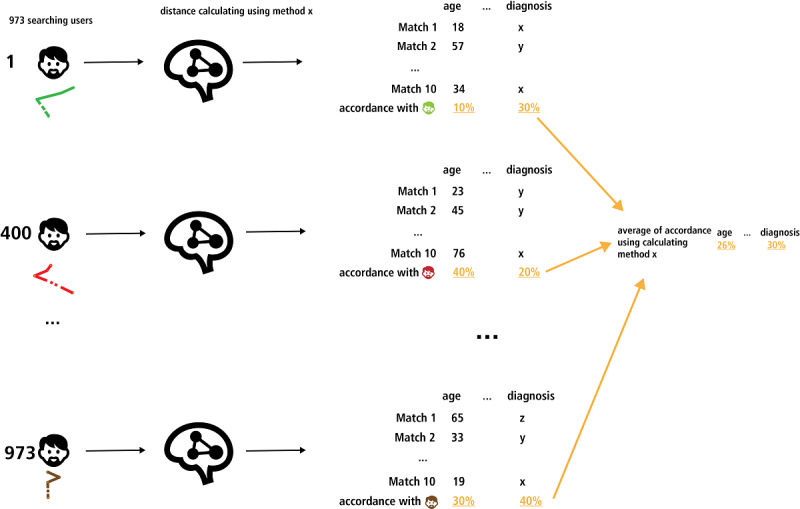
Figure 6.

Schematic illustration of the second part: identifying a matching method for a given data set of users with rare diseases. Ten matches for all 973 data sets with one calculating method, calculating the average of the matching accordance of properties. This figure illustrates the basic principle of the simulation (for the complete testing results, see Multimedia Appendix 5 and Table 1).
