Figure 2.
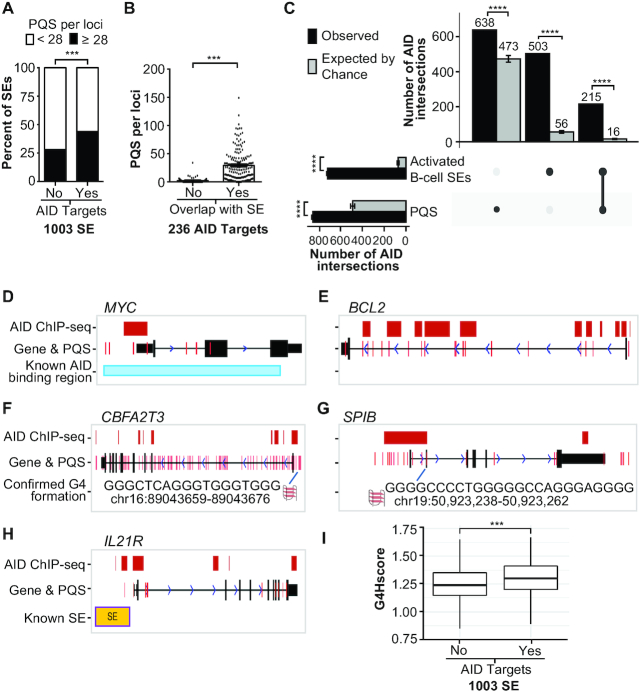
AID targeting loci are enriched for G4-forming sequences. (A) Comparison of the percentage of SE regions previously detected in activated mouse B cells (25) that contain <28 PQSs (white bars) or ≥28 (black bars) according to whether the SE region contained an AID target. ***P < 0.001 as determined by Fisher’s exact test. (B) The mean PQSs per AID-targeted locus according to overlap with an SE region. ***P < 0.001 as determined by a two-tailed Mann–Whitney test. (C) UpSet chart generated using UpSetR package shows the intersection of AID peaks detected in this study with PQS and the activated mouse B-cell SEs, which were lifted over from mm9 to hg19. The observed number of AID peaks shared between PQSs and/or SEs is indicated in the top bar chart (black bars) corresponding to the solid points below the bar chart and each column represents shared AID peaks between the PQS and SEs (linked dots). The gray bars represent the mean of intersection of random shuffling AID peaks (n = 60) with PQSs and SEs. The vertical bar plot reports the intersection of either PQSs or SEs. Data represent mean ± standard deviation. ****P < 1e−57 as determined by a one-sample t-test. (D–H) UCSC genome annotations of stacked tracks beneath genome coordinate positions for each corresponding gene. PQS feature is overlaid on gene track. For gene tracks, solid black blocks connected by horizontal lines representing introns represent coding exons. The 5′ and 3′ UTRs are displayed as thinner blocks on the leading and trailing ends of the aligning regions. Arrowheads on the connecting intron lines indicate the direction of transcription. AID ChIP-seq peak detected in this study (red blocks) overlaps with previously known AID binding site (30) in MYC (D) and PQS located around the exon 1 of BCL2 (E). CBFA2T3 contained enriched AID ChIP binding sites and PQS compared to control reads (F). AID ChIP-seq peak overlapped to multiple PQSs in SPIB (G). AID ChIP-seq peak, PQS and SE were located upstream of IL21R (H). (I) Box plot representing the G4Hscore distribution in SE loci without and with AID-targeted regions. ***P = 4.88e−10 as determined by the Wilcoxon rank-sum test.

