Figure 3.

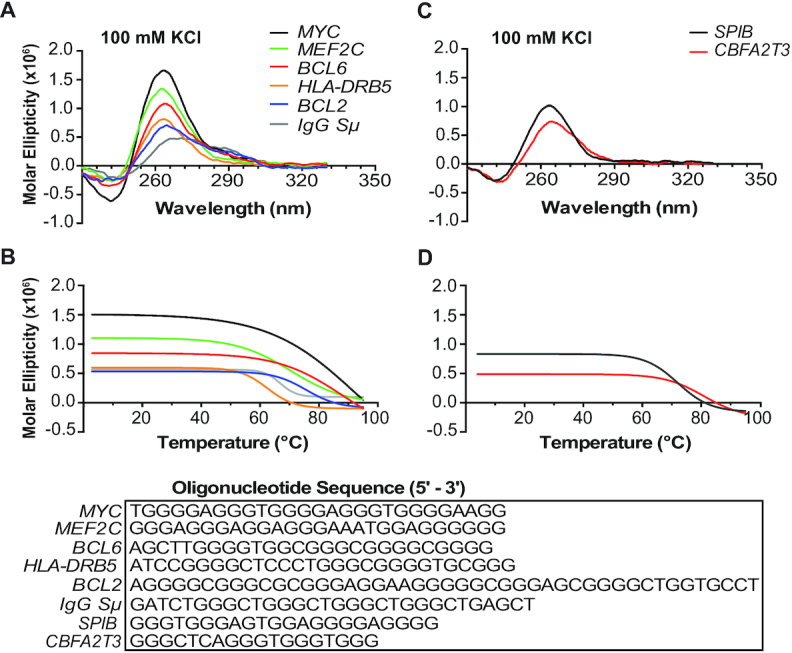
PQSs in AID-targeted and SE regions form stable G4 structures. (A) CD spectra of PQSs found within AID-targeted regions previously identified (25). The BCL2 sequence (blue) was included as a positive control for G4 formation. (B) Corresponding melt curves from the PQSs in (A). (C) CD spectra of selected PQSs found within AID ChIP binding sites in SPIB and CBFA2T3 and the corresponding melt curves (D). All oligomers were prepared in 100 mM KCl–Tris buffer. CD spectra and melt curves are representative of three independent experiments. Sequences are provided for each oligonucleotide.
