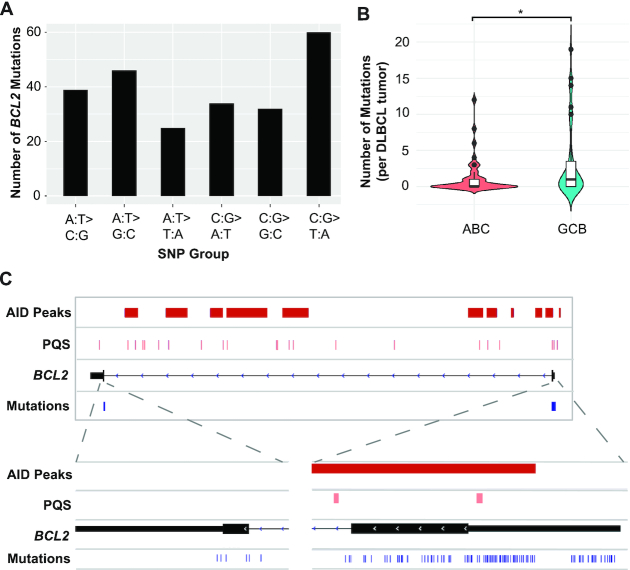
Figure 5.
BCL2 mutations in DLBCL patient samples overlap with both AID binding sites and areas of G4 sequences. (A) BCL2 mutational profile in DLBCL. Frequency of SNPs found in the BCL2 oncogene from 45/77 DLBCL cases using a >75% frequency filter. (B) Violin plot showing the number of mutations in BCL2 for all ABC (n = 34) and GCB cases (n = 35). Median shown as a line with the upper 95% confidence interval (CI) and the black circles above the CI are outliers. *P < 0.05 as determined by a two-tailed Mann–Whitney test. (C) The 45 DLBCL tumors with detectable BCL2 mutations mapped to exon 1 and exon 3. The majority of mutations (229) are located within exon 1 and overlapped with AID peaks from the ChIP-seq (red bars) and PQS (pink bars). There were seven mutations detected in exon 3 that did not overlap with AID signals. Individual mutations are shown for each sample in the expanded panels as blue hash marks.

