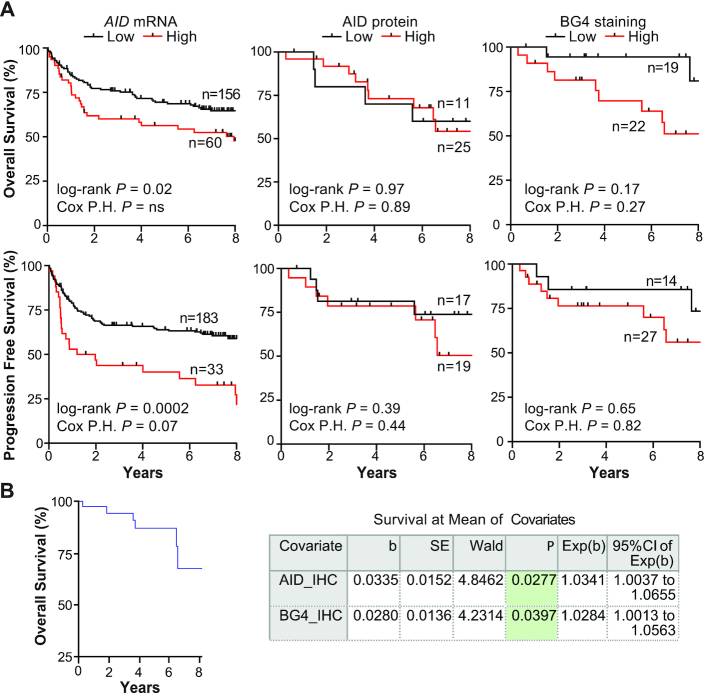
Figure 6.
DLBCL OS and PFS according to AID expression and BG4 staining. (A) Kaplan–Meier curves of OS (top) and PFS (bottom) of DLBCL patients who received RCHOP treatment according to low or high AID mRNA, AID protein or BG4 staining. Cut points were determined using the Youden index derived from ROC curves: AID mRNA, OS > 9.95 and PFS > 10.94 log2 transformed; AID protein, OS > 5% and PFS > 30% positive staining cells; BG4 staining, OS > 61% and PFS > 0%. (B) Plot of the Cox proportional hazards model for 17 matched cases with data for all three variables where mean expression of the covariates is used in relation to survival probability. Corresponding coefficients are shown in the table. P-values were obtained from the log-rank test and the Cox proportional hazards multivariate analysis where DLBCL COO was a covariate.

