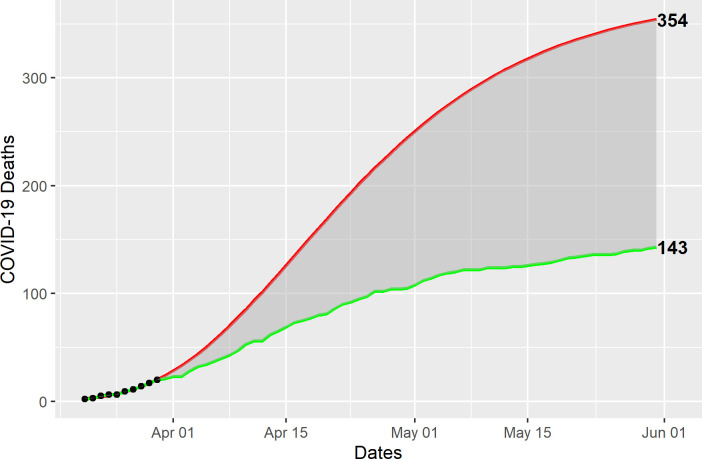
Fig 5. Gompertz model estimates of averted COVID-19 cases deaths.
COVID-19 deaths (dots) from March 17 through March 26 (n = 20) were used to fit a Gompertz model (red line) to estimate the expected number of deaths (n = 354), compared with the observed deaths (green line), through May 31 (n = 143).

