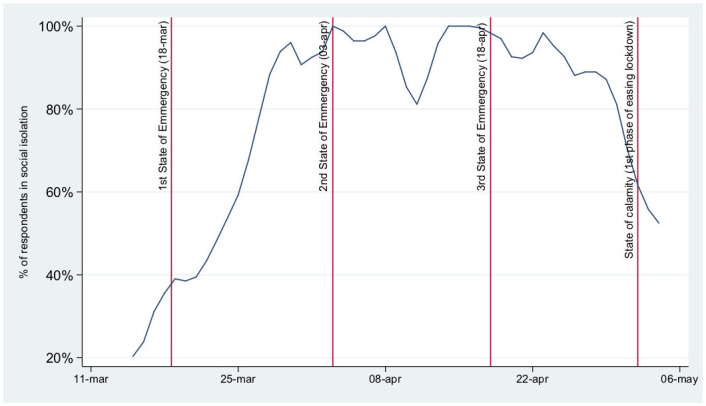
Fig 1. Proportion of respondents with social isolation measures implemented by date (non-cumulative; 3-days moving average).

Note: Vertical lines mark the beginning, renewal and end of the state of emergency.

Note: Vertical lines mark the beginning, renewal and end of the state of emergency.