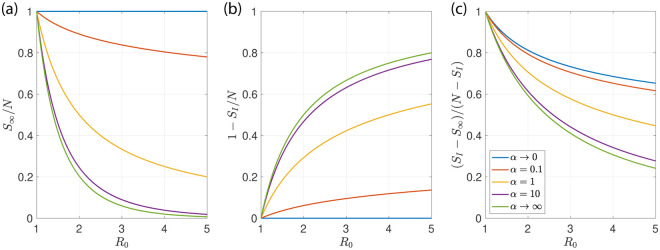
Fig 2. Fraction of susceptible individuals at long times.
(a) Fraction S∞/N of susceptible individuals that remain at long times as a function of the basic reproduction number R0 for different degrees of population heterogeneity characterized by the values of α. The limit α → ∞ corresponds to the classic case with homogeneous populations (green). In the limit α → 0 populations are most heterogeneous (blue). (b) Fraction SI/N of susceptible individuals as a function of R0 at the peak where the number of infected is maximal for different α. (c) Ratio of infections after the peak Sm − S∞ and infections before the peak N − Sm as a function of R0.

