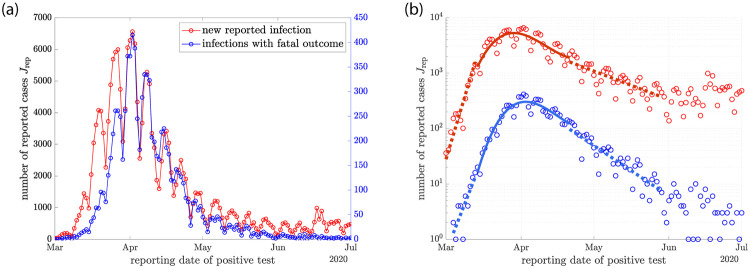
Fig 3.
(a) Daily new SARS-CoV-2 infections reported in the early months of 2020 in Germany. The number of new reported infections per day (red symbols) is shown together with the number of reported infections per day for those cases with later fatal outcome (blue symbols). (b) Semi logarithmic representation of the same data. The dashed and solid lines represent linear and cubic fits to the data in specific time intervals. They are used to estimate the initial and final growth rates λ0 and λ∞ as well as and at the maximum of the rate of new cases Jmax. We find λ0 ≃ 0.269 day−1 (0.336 day−1), λ∞ ≃ −0.068 day−1 (−0.038 day−1), A2 ≃ −10−2 day−2 (−0.9110−2 day−2) and A3 ≃ 6.810−4 day−3 (7.510−4 day−3) for the fatal cases (for all reported cases).

