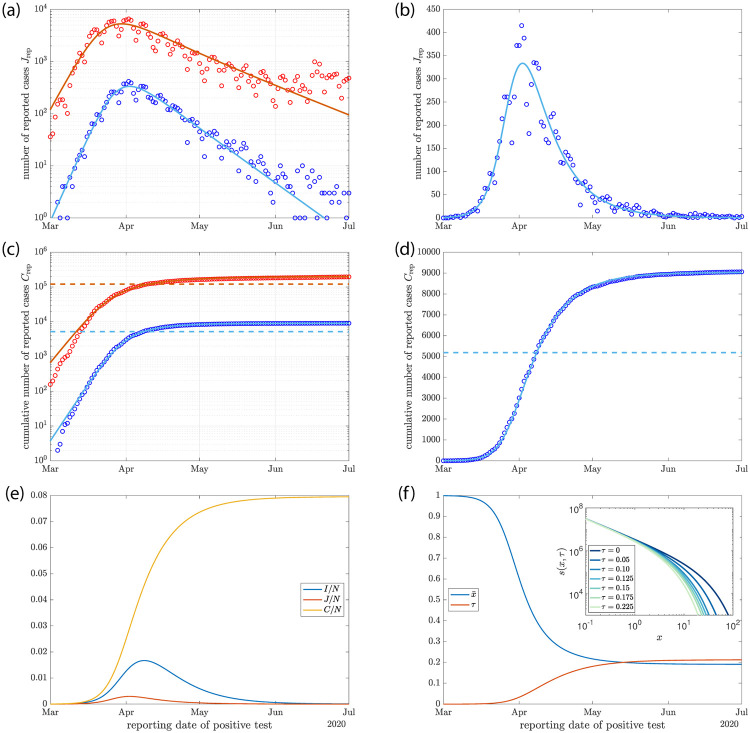
Fig 4. Time course of the SARS-CoV-2 epidemic in Germany (symbols) compared to solutions of the heterogeneous SIR model (lines).
(a) and (b) Data on daily reported infections (red) and on reported infections with later fatal outcome (blue) as logarithmic and linear plots. (c) and (d) same data and model solutions as in (a) and (b) but for cumulative numbers of cases. The horizontal dashed lines indicate scaled herd immunity levels. Parameter values for the model solution are R0 = 2.67 (R0 = 3.91), γ = 0.146 (γ = 0.069), α = 0.05 and N = 8107 for the fatal cases (for all cases). The case fatality rate that corresponds to this solution is f = 0.13% (f = 0.11%). (e) Time courses of the fraction of infected I/N (blue), the new cases per day J/N (red) and the fraction of cumulative cases C/N (yellow) for R0 = 2.67 and γ = 0.146. (f) Time course of the average susceptibility (blue), where R is the time dependent reproduction number and of (red) for the solution shown in (e). Inset: distributions of susceptibility in the population for different values of τ.

