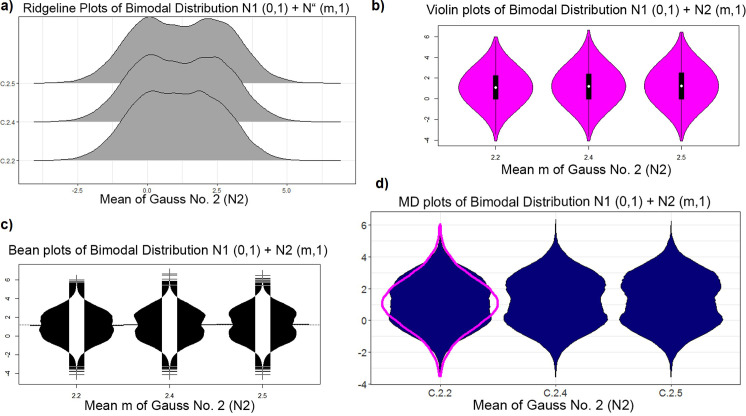
Fig 3.
Plots of the bimodal distribution of changing mean of second Gaussian: Ridgeline plots (a) of ggridges on CRAN [41], violin plot (b), bean plot (c), and MD plot (d). Bimodality is visible beginning with a mean of 2.4 in a bean plot, ridgeline plot and MD plot, but the MD plot draws a robustly estimated Gaussian (magenta) if statistical testing is not significant, which indicates that the distributions are not unimodal with a mean of two. The bimodality of the distribution is not visible in the violin plot [4] of the implementation [34]”.

