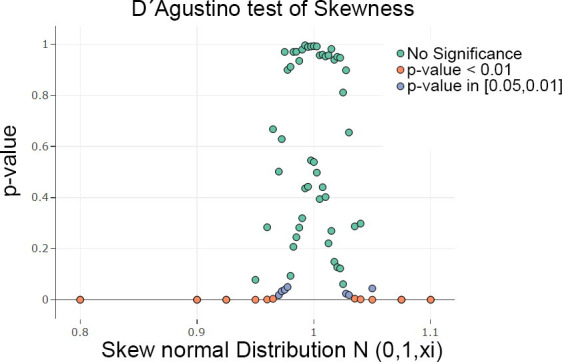
Fig 4. Scatterplots of a Monte Carlo simulation in which samples were drawn and testing was performed in a given range of parameters in 100 iterations.

The visualization is restricted to the median and 99 percentile of the p-values for each x value. The D'Agostino test of skewness [14] was highly significant for skewness outside of the range of [0.95,1.05] in a sample of n = 15.000. Scatter plots were generated with plotly [32].
