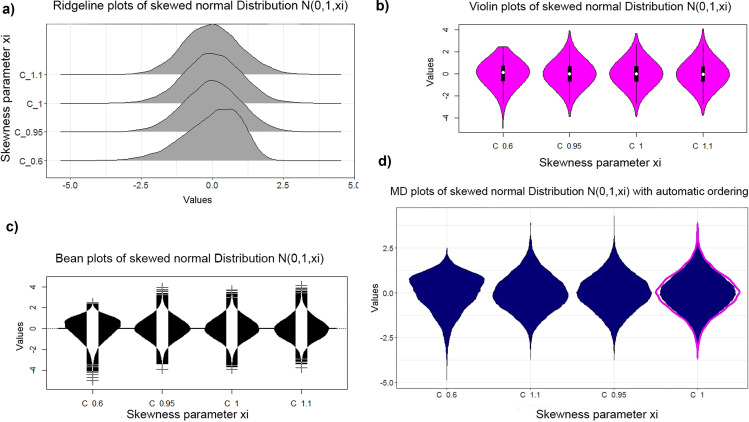
Fig 5.
Plots of skewed normal distribution with different skewness using the R package fGarch [51] on CRAN: Ridgeline plots (a) of ggridges on CRAN [41], violin plot (b), bean plot (c) and MD plot (d). The sample size is n = 15000. The violin plot is less sensitive to the skewness of the distribution. The MD plot allows for an easier detection of skewness by ordering the columns automatically.

