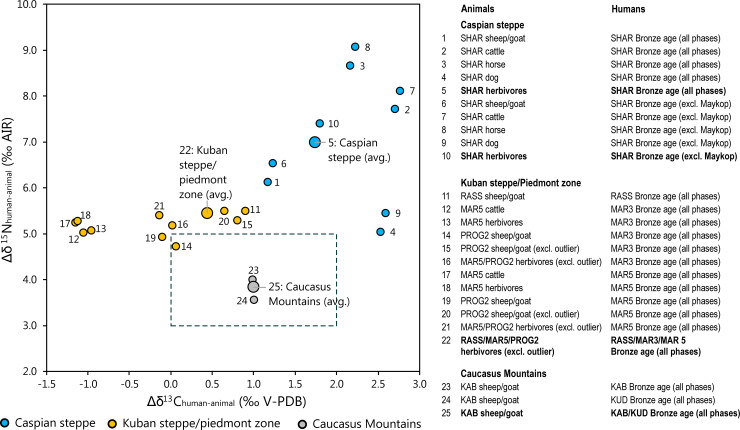
Fig 9. Differences between δ13C and δ15N values of bone collagen of humans and animals of different species from the Caucasus Mountains, Kuban steppe/piedmont zone, and the Caspi steppe (cf. S2 Table).
The box indicates the typical isotopic spacing between two adjacent trophic levels. Δδ13Chuman-animal and Δδ15Nhuman-animal values within that range are in agreement with a human diet based on the respective animal sources. The numbers in the graph correspond to the numbers in the list of paired animal and human datasets to the right.

