Figure 2.
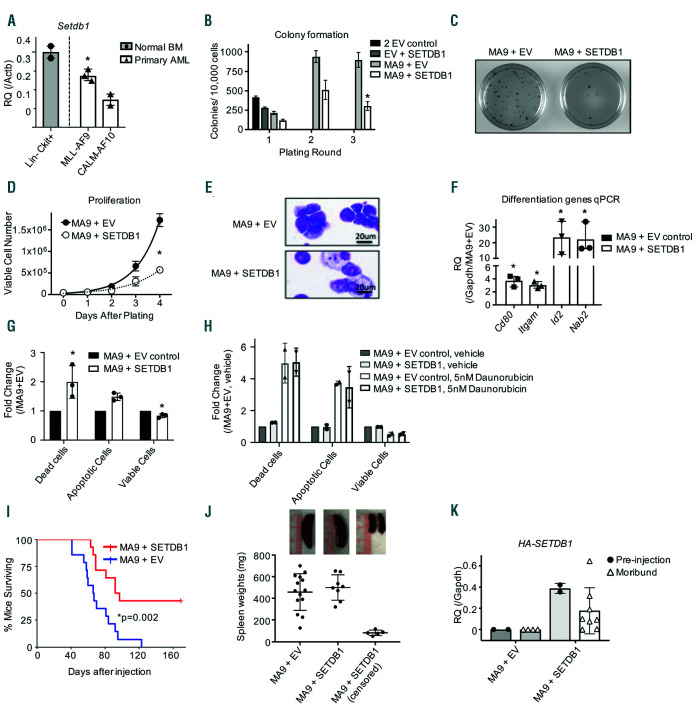
Overexpression of SETDB1 delays acute myeloid leukemia growth. (A) Quantitative PCR (qPCR) using primers for mSetdb1 to determine expression levels in primary MLL-AF9 (n=3) or CALM-AF10 (n=2) acute myeloid leukemia (AML) cells compared to Lin-cKit+ mouse bone marrow hematopoietic stem and progenitor cell (HSPC) (n=2 pools of 5 mice each). (B) Mouse Lin- bone marrow was retrovirally transduced with the indicated plasmid vectors and plated in methylcellulose. Colonies were counted after 7 days and re-plated, for a total of three rounds. Shown is one representative experiment of n=4, error bars are standard deviations of the technical replicates. (C) Representative Iodonitrotetrazolium chloride (INT) staining of colony assay plates for MA9 cells with or without SETDB1 overexpression. Images were taken on a BioRad ChemiDoc XRS+ at 1X magnification at the same time with the same contrast. (D) Lin- bone marrow cells were retrovirally transduced with MA9 in the presence or absence of SETDB1 overexpression, selected for 2 weeks, then proliferation was monitored by viable cell count daily. Shown is one representative experiment of n=4. Error bars are standard deviations of technical replicates. (E) Representative cytospin and Hema3 stained MA9 cells in the presence or absence of SETDB1 overexpression (n=3). (F) qPCR measurement of genes associated with differentiation in MA9 cells in the presence or absence of SETDB1 overexpression. Data are normalized to glyceraldehyde 3-phosphate dehydrogenase (Gapdh) relative to MA9+EV gene expression (delta delta ct), n=3. Error bars are standard deviation of delta delta ct. (G-H) Quantification of fluorescence-activated cell sorting (FACS) analysis to determine the relative amount of live, dead, and dying cells in (G) resting AML cells or (H) AML cells treated with Daunorubicin. Cells were stained with FITC-Annexin V and DAPI and run on an LSRII flow cytometer. Cells are defined as follows: AnnexinV+,DAPI+ = dead; AnnexinV-,DAPI- = alive; AnnexinV+,DAPI- = apoptotic. Shown are relative quantifications comparing the SETDB1 overexpression cells to control. Error bars indicate standard deviations. (G) n=3, (H) n=2. (I) Survival for MLL-AF9 AML mouse model. Primary MA9 cells were transduced with SETDB1 or EV control and selected for 4 days prior to tail vein injections in sublethally irradiated mice. Shown is the Kaplan Meier survival curve; MA9+EV n=14; MA9+SETDB1 n=8 (six censored mice did not develop AML). (J) Spleen weights of moribund or censored mice from MLL-AF9 AML mouse model. Error bars represent standard deviations. Above are representative images of spleens from euthanized mice. (K) qPCR using primers specific for the HA-SETDB1 exogenous construct from the AML mouse model to measure expression of the plasmid. RNA was harvested before injection or from moribund mice (n=2, 4 MA9+EV preinjection, moribund mice; n=2, 8 MA9+SETDB1 pre-injection, moribund mice). Error bars represent standard deviations. Statistics: significance was determined by: two-sample t-test comparing relative expression (Actb or Gapdh) of AML primary cells to Lin-cKit+ for Setdb1 expression(A) or MA9+SETDB1 to MA9+EV for four different genes’ expression (F); generalized linear modeling followed by ANOVA where each MA9+SETDB1 replicate was paired to the MA9+EV control from the same biological replicate. Main effect is reported if there are no significant interactions (see statistical analysis in the Online Supplementary Materials and Methods). (B/D/G/H); Log-rank test (I). MA9: MLL-AF9; EV: empty vector control; n: biological replicates; *: P<0.05: Actb: beta actin; Gapdh: glyceraldehyde 3-phosphate dehydrogenase.

