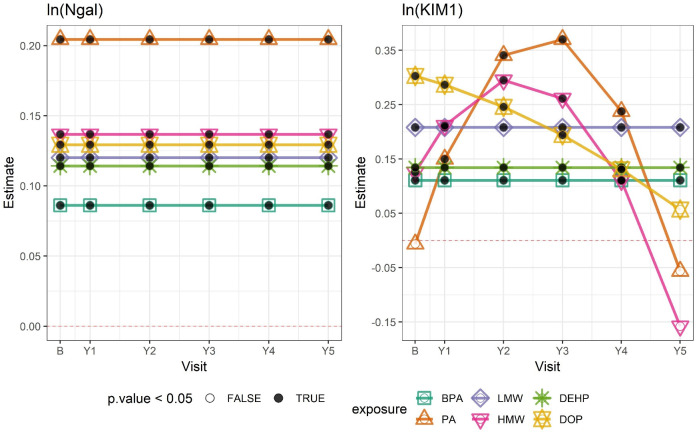
Fig 1. Associations between ln-transformed chemical exposures and ln-transformed biomarkers of tubular injury by study visit.
Outcome estimates were derived from adjusted linear mixed-effects (LME) models and correspond to a 1–standard deviation change in each ln-transformed chemical exposure. Numerical estimates are shown in S3 Table. The horizontal dashed line indicates 0. Black dots indicate that the estimate had a p-value < 0.05; white dots indicate a p-value ≥ 0.05. B, baseline; BPA, bisphenol A; DEHP, di(2-ethylhexyl) phthalate; DOP, di-n-octyl phthalate; HMW, high molecular weight phthalates; KIM1, kidney injury molecule-1; LMW, low molecular weight phthalates; Ngal, neutrophil gelatinase-associated lipocalin; PA, phthalic acid; Y[number], year [number].

