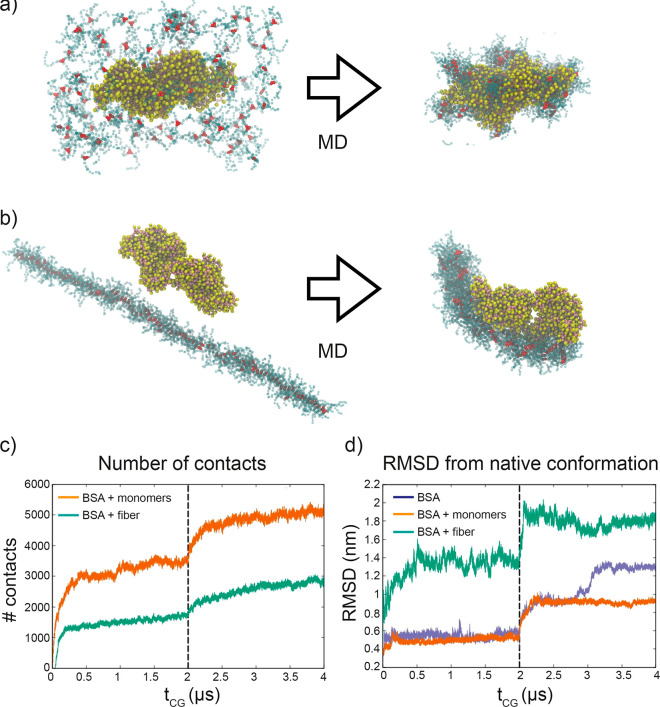
Figure 3.
CG modeling of BSA interaction with BTA-OEG4. (a) BSA dimer (yellow and pink beads) interacting with 100 disassembled BTA-OEG4 monomers (red and blue beads) and (b) BSA dimer interacting with the BTA-OEG4 fiber composed of 100 monomers. The snapshots on the left show the initial configuration, while those on the right are taken after 2 μs of CG-MD. VMD was used for visualization and rendering of the systems.57 (c) Evolution of the number of contacts between BSA and BTA-OEG4 in the two systems (a) and (b). (d) Evolution of root-mean-square displacement (RMSD) of BSA conformation from the native structure, for the two systems (a) and (b) and for a control system with BSA in water. The first 2 μs of CG-MD in (c) and (d) employed an elastic network potential, which was removed after 2 μs (vertical dashed line).

