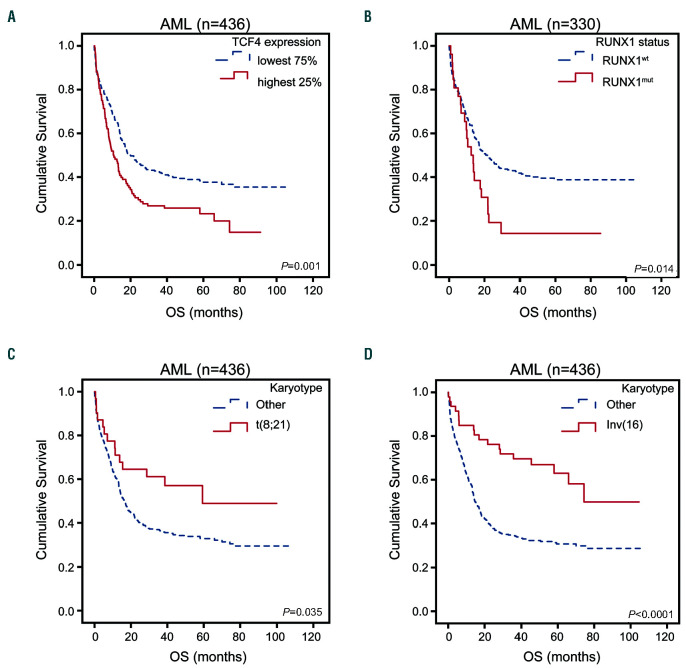
Figure 2.
Overall survival (OS) curves for acute myeloid leukemia patients with available data stratified on (A) TCF4 expression, lowest 75% (n=324), highest 25% (n=108); (B) RUNX1 mutational status, RUNX1 wild-type (n=304), RUNX1 mutation (n=26); (C) presence (n=31) or absence of t(8;21) (n=405); (D) presence (n=47) or absence of inv(16) (n=389).

