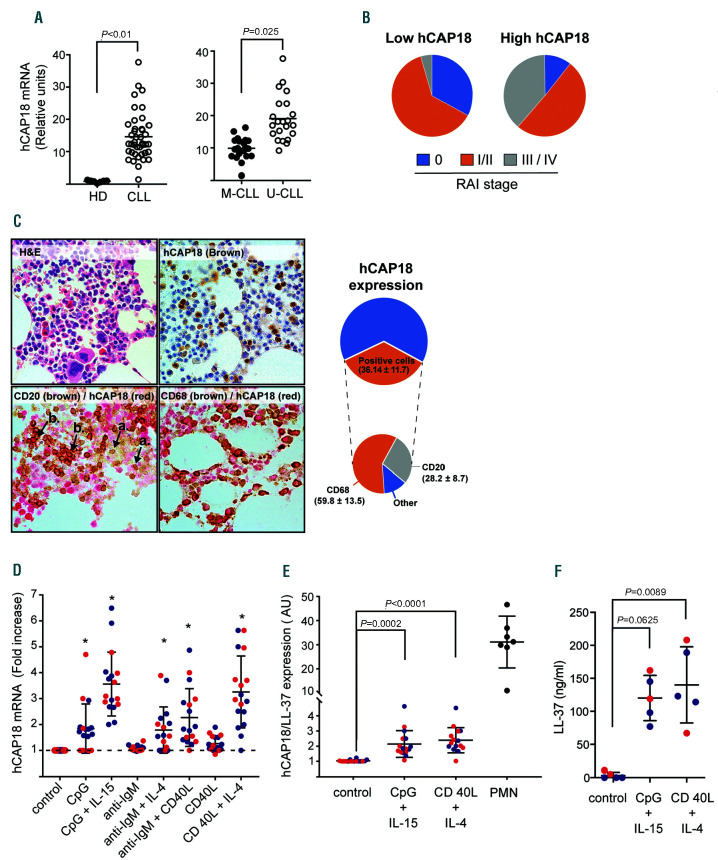
Figure 1.
hCAP18/LL-37 expression in chronic lymphocytic leukemia cells. (A) Left panel: hCAP18 mRNA expression was evaluated in purified B-cells from healthy donors (HD) (n=7) and chronic lymphocytic leukemia (CLL) cells (n=41) samples by qRT-PCR. Results were normalized to b-actin human gene and are represented as relative units (2-Δctx103). Statistical analysis was performed using Mann-Whitney test. Shown are individual values and mean ± standard error of the mean (SEM). Right panel: hCAP18 mRNA expression on CLL cell samples discriminated based on their immunoglobulin heavy chain variable region (IGHV) mutational status. Unmutated (U-CLL) n= 21, Mutated (M-CLL) n=20. (B) The average expression of mRNA hCAP18 in CLL cell samples was calculated and patients were separated into two groups: those with hCAP18 levels below the average (low-hCAP18) and those with hCAP18 levels above the average (highhCAP18). c2 test showed a statistically significant association between hCAP18 expression and CLL clinical stage (Rai staging). (C) Expression of hCAP18/LL-37 on bone marrow biopsies from CLL patients. Samples were doubled-stained to identify LL-37 in myeloid cells (CD68+) and CLL cells (CD20+) as detailed in the Online Supplementary Materials and Methods. Shown are representative pictures for haematoxylin and eosin (H/E) staining, hCAP18 single staining and CD68+ or CD20+/hCAP18 double staining, n=5 (left panel). Image magnification: 600x. Arrow heads represent hCAP18 single positive cells (a) or double positive (CD20/hCAP18) cells (b). In the right panel, pie charts displaying the total percentage of hCAP18 positive cells and the contribution of each cell type (CD68+,CD20+ and others) are shown (D) hCAP18 mRNA expression in CLL cells stimulated with CpG (5 mg/mL), CpG + IL-15 (10 ng/mL), immobilized anti-IgM antibody (Ab) (0.1 μg/mL), anti-IgM Ab + IL-4 (15 ng/mL), anti-IgM Ab + CD40L (500 ng/mL), CD40L or CD40L + IL-4 for 48 hours (h) at 37ºC. Results are expressed as fold increase compared to control (unstimulated condition). Statistical analysis was performed using Friedman test and Dunn’s multiple comparison test. Shown are individual values and mean ± standard error of the mean (SEM). Blue dots correspond to M-CLL and red dots to U-CLL samples. Asterisks represent P<0.05. E. Intracellular expression of hCAP18/LL-37 in CLL cells activated with CpG + IL-15 or CD40L + IL-4 for 48 h at 37ºC. Results are expressed as the ratio of median fluorescence intensity (MFI) of hCAP18/LL-37 to MFI of isotype control in CD19+ cells (blue dots: M-CLL, red dots: U-CLL) or in PMN (positive control). Individual values and mean ± SEM are shown. F. LL-37 concentration in culture supernatants of activated CLL-cells quantified by enzyme linked immunabsorbant assay (ELISA). Statistical analysis was performed using Friedman test and Dunn’s multiple comparison test (P<0.05). Shown are individual values and mean ± SEM. (blue dots: M-CLL, red dots: U-CLL).

