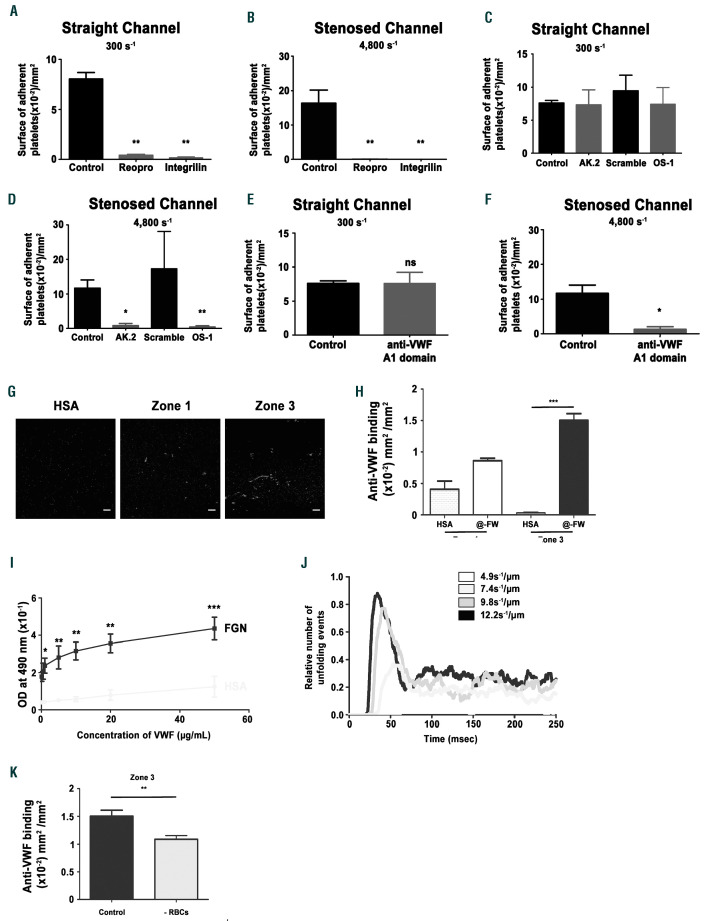
Figure 4.
Integrin αIIbβ3 flow and the GPIb/VWF axis support platelet adhesion under shear rate gradients (SRG). Hirudinated human whole blood was perfused through channels of microfluidic chambers coated with a fibrinogen solution (300 µg/mL) at indicated local wall shear rates. The blood was incubated with the anti-αIIbβ3 blockers, Reopro: 40 µg/mL or Integrilin: 40 µg/mL (A- B), the blocking anti-GPIbα antibody AK2 (10 µg/mL), (C-D), the anti- GPIbα peptide OS-1 (800 nM), (C-D), the anti-VWF A1 domain antibody 701 (20 µg/mL), (E-F), or with PBS (A- B), an irrelevant antibody (C-F), or a scrambled peptide (C-D) as a control. The bar graph represents the surface of adherent platelets obtained after 5 min of perfusion. The surfaces represent the mean ± standard error of the mean (SEM) in six random field of four to six separate experiments performed with different blood donors. *P<0.05, **P<0.01. (G) Representative immunofluorescence images of zone 1 and zone 3 depicting von Willebrand factor (VWF) labelling after perfusion of platelet-poor plasma (PPP) reconstituted with red blood cells (RBC) over immobilized fibrinogen (300 µg/mL) or human serum albumin (HSA), (300 µg/mL) within the channels of the microfluidic chambers at 300 s-1. (H) The bar graph represents the surface of VWF labelling per mm² on fibrinogen or HSA after 5 min of perfusion in zone 1 or zone 3. ***P<0.001. (I) Microwells were coated overnight at 4°C with fibrinogen or HSA at 10 µg/mL. Increasing concentrations of purified VWF were then added, and bound VWF was detected with a peroxydase-conjugated anti-VWF antibody. Curves show the optical density (OD) at 490 nm, and values are the mean ± SEM in three separate experiments performed in duplicate. (J) Prediction model for the relative number of VWF unfolding events in entrance of zone 3 under indicated SRG. (K) PPP was mixed or not with RBC and perfused through stenosed channels of microfluidic chambers coated with fibrinogen (300 µg/mL) at 300 s-1. The channels were labeled with an anti-VWF antibody. The bar graph represents the surface of VWF staining per mm² in zone 3 after 5 min of perfusion. **P<0.01.

