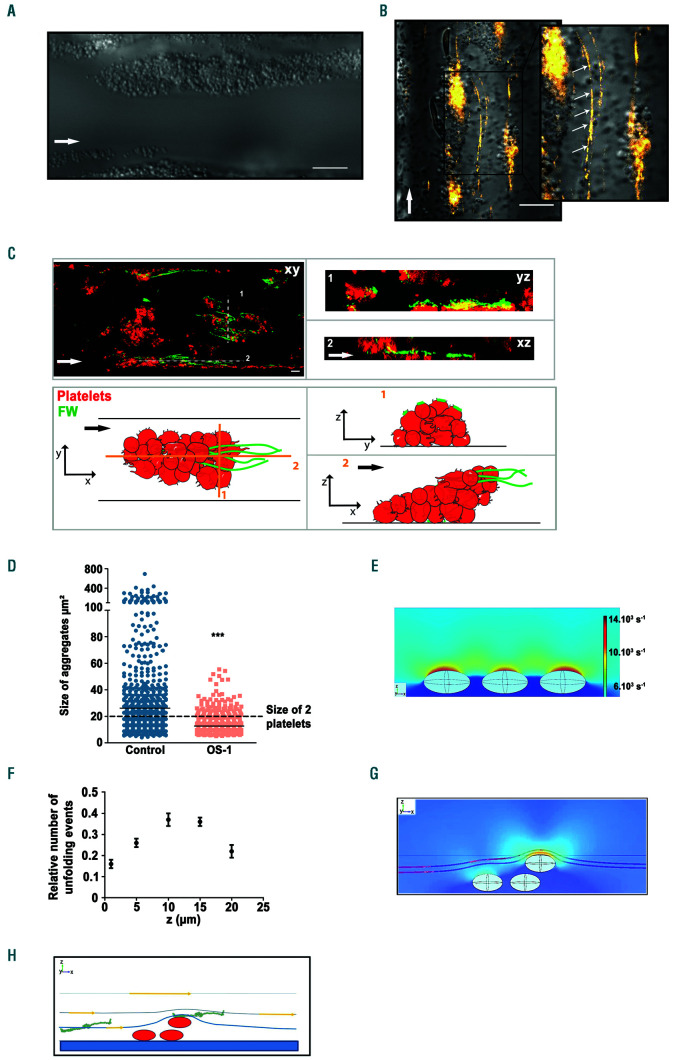
Figure 5.
The enhanced platelet aggregation under shear rate gradients occurring on fibrinogen results from plasma von Willebrand factor fiber formation. Hirudinated human whole blood was perfused through channels of the microfluidic flow chamber coated with a solution of fibrinogen (300 µg/mL). (A) Representative differential interference contrast (DIC) microscopy image obtained in zone 3. Scale bar: 20 µm. (B) Representative DIC/fluorescent images represent the platelet aggregates (DIC) and VWF fibers (orange) formed in zone 3 following shear rate gradients (SRG). Scale bar: 20 µm. (C) Representative confocal images and schematic of platelet aggregates formed in zone 3. Platelets appear in red (RAM.1-Cy3 at 2 µg/mL), von Willebrand factor (VWF) in green (anti-VWF-Alexa488 at 2 µg/mL), and the overlay in yellow. Scale bar: 10 µm. Schematic of platelet aggregates (red) and VWF fibers (green) formed in zone 3 following SRG. (D) Dot plot represents the size of aggregates formed in presence or absence of OS-1 that was perfused once a platelet monolayer on fibrinogen had already formed. The shading corresponds to the standard error of mean (SEM). Data were compared by 2-tailed Mann-Whitney tests, *P<0.0001. (E) Computational fluid dynamic (CFD)-derived heatmap of shear rate values calculated for the system of three adhered platelets in the stenosed part of the chamber. The central section of system is shown. Platelets were placed in the central z-x plane of the stenosed part of chamber, near the wall. Hydrodynamic conditions are the same as described in Figure 1E. (F) The dependence of maximum relative number of VWF unfolding events on the height above the fibrinogen surface. Computational modeling of VWF dynamics was performed using the CFD-derived values of shear and elongation rates at different heights above the surface. For each height 100 simulations of long VWF multimers dynamics were obtained. Given values correspond to zone 2-zone3 connection, where VWF unfolding was maximal (see peaks at Figure 4J). VWF molecule was considered unfolded only if its maximal size exceeded contour length of the multimer. Data correspond to the same hydrodynamic conditions as used for Figure 1E and Figure 5E (maximal SRG of 7.4 s-1/µm ). (G) The effect of flow line contraction illustrated with CFD simulation for system of three ellipsoidal platelets. The flow lines are shown in dark red color. Note the convergence of flow lines above the platelets. (H) Schematic illustration of the consequence of flow line contraction effect: objects of finite size (like flowing VWF depicted in the figure or platelet) traveling at some distance above the surface will eventually interact with the obstacle (platelet aggregate) due to flow line convergence above the obstacle (platelet) leading to much closer distance between the flowing object and the barrier (platelet).

