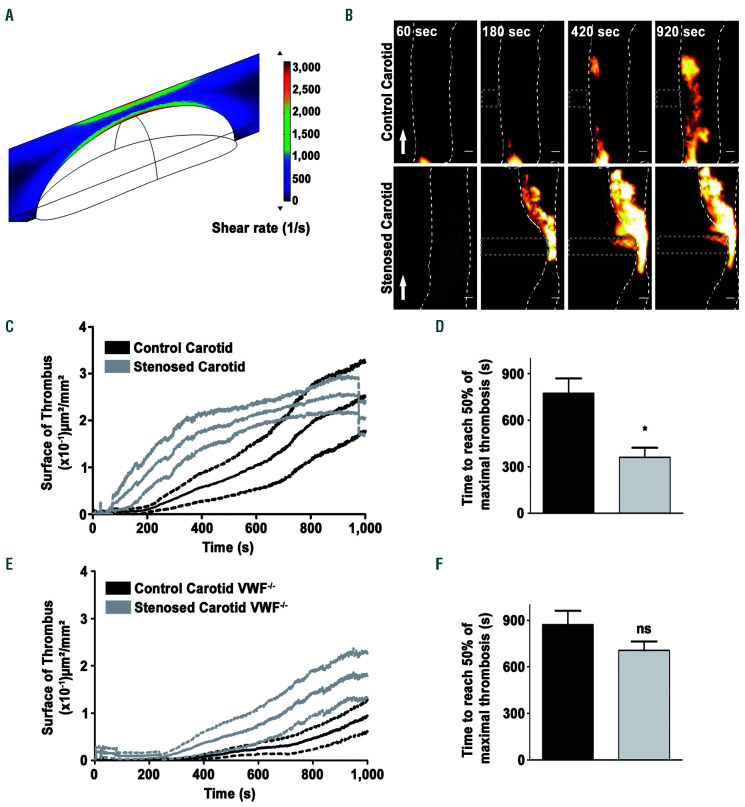
Figure 6.
Thrombus growth is accelerated under shear rate gradients (SRG) in an injured mouse carotid artery. The common carotid arteries of adult mice were exposed and a filter paper saturated with FeCl3 was placed laterally on the left vessel for 2.5 minutes (min). After 4 min, the vessel was pinched with a micromanipulator to realize an 80% stenosis. (A) Computational fluid dynamic analysis presenting the wall shear rate (WSR) heat map at the middle of the stenosis carotid artery (y=0) with a radius of 250 μm containing a stenosis with a width of 400 µm and a length of 1.35 µm throughout the whole vessel. (B) Representative fluorescent images of a thrombus forming after vessel injury obtained by labeling the platelets with DiOC6. Scale bar: 100 µm. Arrows indicate direction of blood flow. (C) Tracings representing the mean surface area (± standard error of the mean [SEM], n = 9) of thrombus growth after application of FeCl3 in the presence or absence of a stenosis. (D) Bar graph represents the time needed to obtain half maximal thrombus area. The shading corresponds to the SEM. Data were compared by 2-tailed Mann- Whitney tests, *P<0.05. (E) Tracings representing the mean surface area (± SEM, n=5) of thrombus growth after application of FeCl3 and stenosis on a carotid of VWF-/- mice. (F) Bar graph represents the time in seconds (s) needed to obtain half maximal thrombus area. The shading corresponds to the SEM. Data were compared by 2-tailed Mann-Whitney tests, P>0.05.

