
Figure 1. Generation of GBOs that Retain Histologic Features of Parental Tumors.
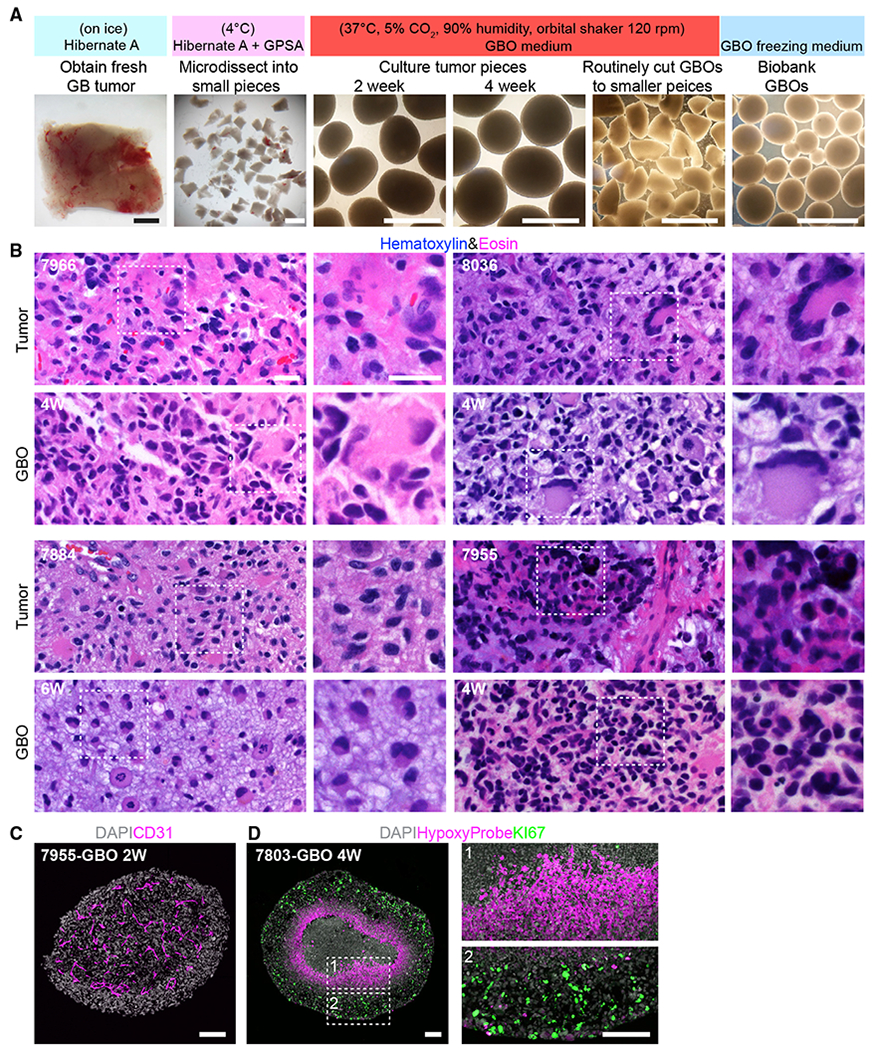
(A) A schematic of the procedure with sample bright-field images. Scale bar, 1 mm.
(B) Sample H&E staining images of parental tumors and corresponding GBOs. Age of GBOs in weeks (W) is listed. Scale bars, 20 μm.
(C) Sample confocal image of micro-vasculature retained in GBO with immunostaining for CD31. Scale bar, 100 μm.
(D) Sample confocal images showing the hypoxia gradient present in a large GBO with immunostaining for HypoxyProbe and KI67. Insets highlight KI67+ proliferating cells at the periphery (box 2), but not in the hypoxic core (box 1). Scale bars, 100 μm.