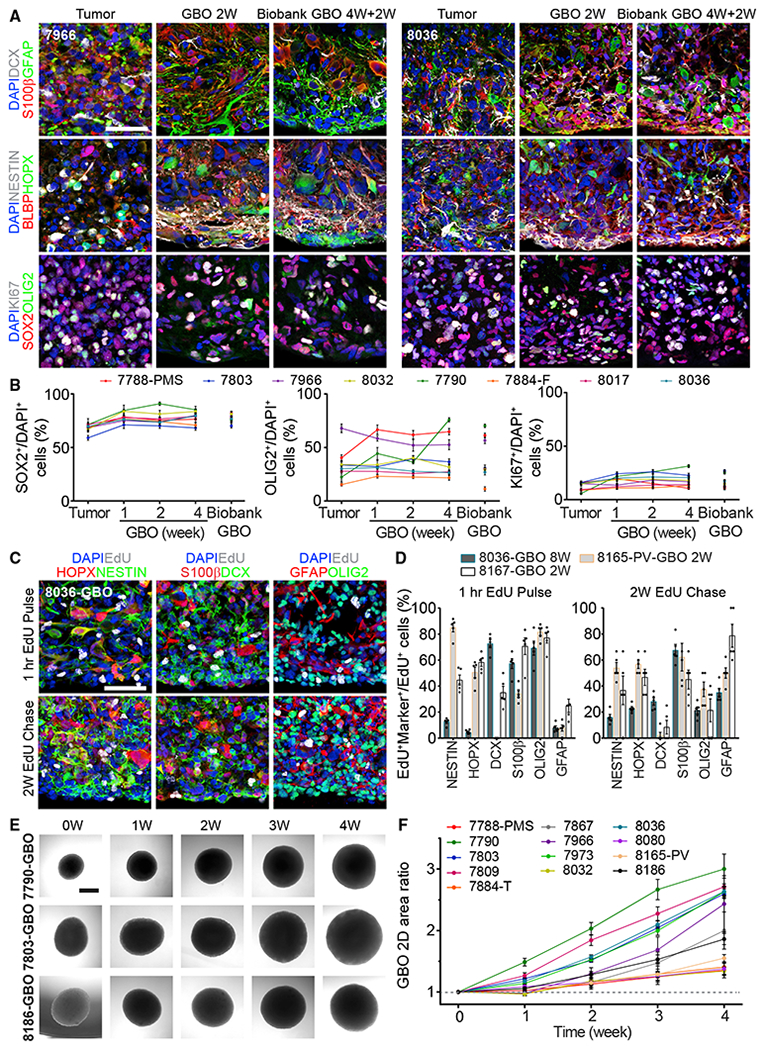
Figure 2. GBOs Retain and Continuously Generate Heterogeneous Cell Populations.

(A) Sample confocal images of immunostaining for different markers showing the maintenance of parental tumor cell populations in cultured GBOs and GBOs recovered from the biobank for two patients. See Figure S1A for additional samples. Scale bar, 50 μm.
(B) Quantifications of SOX2+, OLIG2+, and KI67+ cells in 8 parental tumors, corresponding GBOs for different culture periods, and those recovered from the biobank (4W+2W). Values represent mean ± SEM (n = 5).
(C and D) EdU pulse-chase experiments. GBOs were incubated with 1 μM EdU for 1 h and immunohistology for different markers was performed 1 h and 2 weeks later. Shown are sample confocal images (C; scale bar, 50 μm) and quantifications of EdU+Marker+ cells among EdU+ cells after 1-h EdU pulse and 2-week EdU chase (D). Dots represent data from individual GBOs and bar values represent mean ± SEM (n = 5).
(E and F) Growth of biobanked GBOs after recovery. Shown are sample bright-field images of individual GBOs recovered from the biobank (E; scale bar, 500 μm) and quantification of the ratio of the measured 2D area at each time point to the 2D area at time point 0 for the same GBOs recovered from the biobank (F). Values represent mean ± SEM (n = 10 GBOs per sample).
See also Figures S1 and S2 and Tables S1 and S2.
