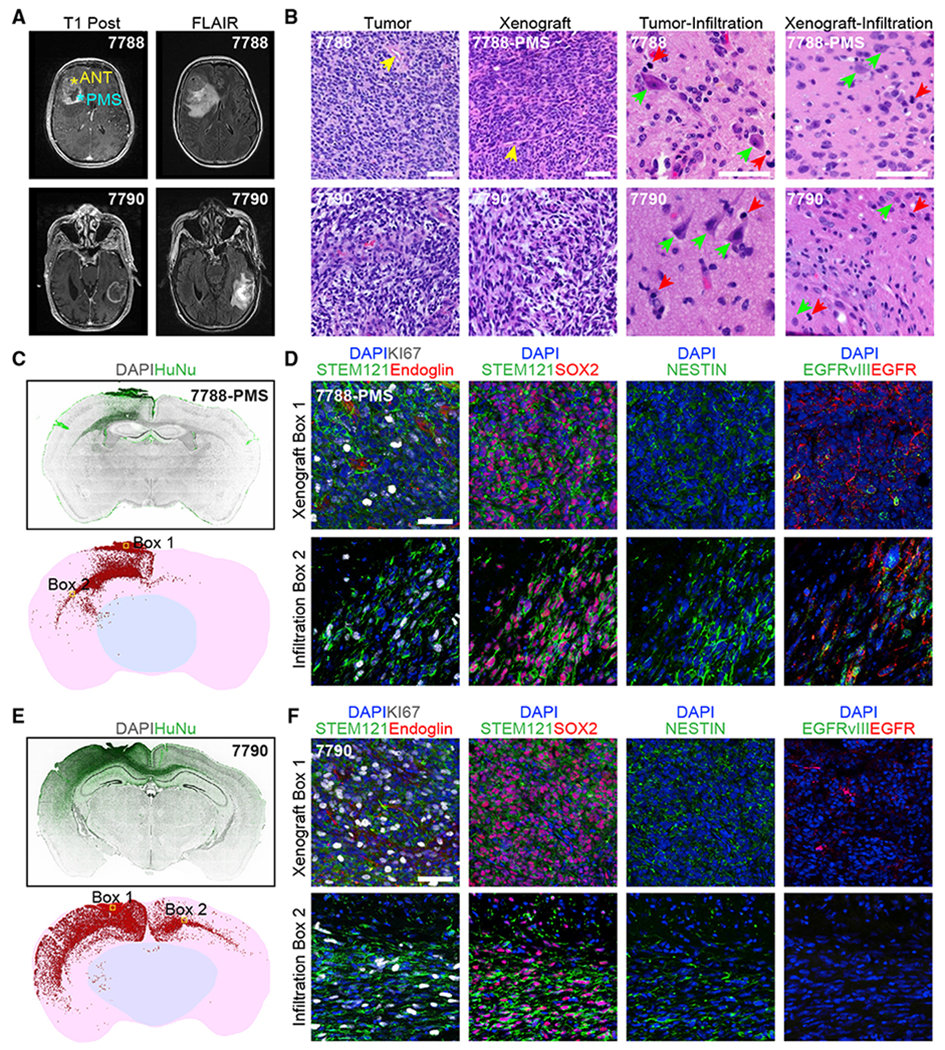
Figure 5. Orthotopic Transplantation of GBOs into Adult Immunodeficient Mice Displays Efficient Engraftment and Extensive Infiltration into the Brain Parenchyma.

(A) MRI T1 post-contrast (left) and FLAIR (right) patient brain images.
(B) Sample H&E staining images of the tumor bulk versus infiltrated areas of parental patient tissues and the original xenograft sites and infiltrated areas for corresponding GBOs at 2 months post-transplantation. Prominent blood vessels (yellow arrow heads) are observed in both the tumor bulk in patients and original GBO xenograft sites in mice. Infiltrated areas are shown with human neurons and mouse neurons (green arrow heads) and tumor cells (red arrow heads), respectively. Scale bar, 100 μm.
(C and D) Xenograft of UP-7788-PMS-GBO at 2 months post-transplantation. (C) Coronal section views of human nuclear antigen (HuNu) immunostaining (top) and reconstruction for quantification of infiltrated cells (bottom). Each red dot represents a HuNu+ cell. (D) Sample confocal images of areas in box 1 and 2 in (C, bottom panel) for immunostaining of human-specific cytoplasmic antigen (STEM121) showing the extensive vascularization from the host (endoglin immunostaining) in the original xenograft site, and proliferation (KI67 immunostaining), progenitor (SOX2, NESTIN immunostaining), and EGFR/mutant EGFRvIII expression status of tumor cells in the original xenograft site (box 1) and the infiltrated area (box 2). Scale bar, 50 μm.
(E and F) Xenograft of UP-7790-GBO at 2 months post-transplantation. Cornal section image and reconstruction (E) and sample confocal images in box 1 and 2 (F) are similar as in (C) and (D).
