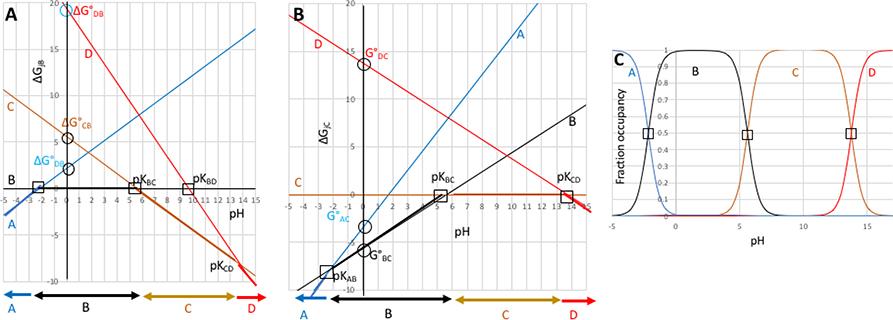
Figure 2. Relative standard state free energies (ΔG°) and relative number of protons (Δm) is all that is needed to completely describe the pH dependence of a system with multiple protonation states.
2A: The relative free energies of the states A,B,C, and D as a function of pH given the pKas in Table 1 transformed to standard state free energies, ΔG° (Table 2). Relative free energies of microstates change linearly with respect to pH (eqn. 2b). Squares are input pKas which can be experimentally observable. Circles mark ΔG°jB, the free energies at pH 0 of the other three states relative to B. Horizontal arrows at the bottom show the state at lowest free energy (dominant population) in each pH range. 2B): states A, B, C and D with state C as the reference; 2C): Titration showing relative state populations vs pH predicted using ΔG°s in Table 2 and equations 3 and 4. This plot is the same independent of which state is used as the reference. ΔG is given in unitless free energies where a unit change in ΔG yields a 10-fold population change.

