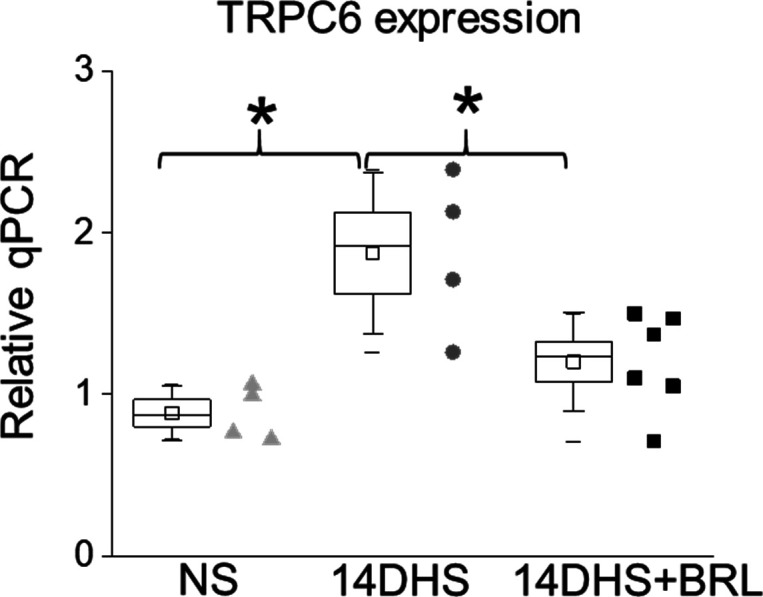
Figure S4. Quantitative real-time PCR analysis of mRNA expression levels of TRPC6.

Measurements were performed in the kidney cortex in normotensive (NS), hypertensive (14DHS), and hypertensive opioid-treated (14DHS+BRL) groups.

Measurements were performed in the kidney cortex in normotensive (NS), hypertensive (14DHS), and hypertensive opioid-treated (14DHS+BRL) groups.