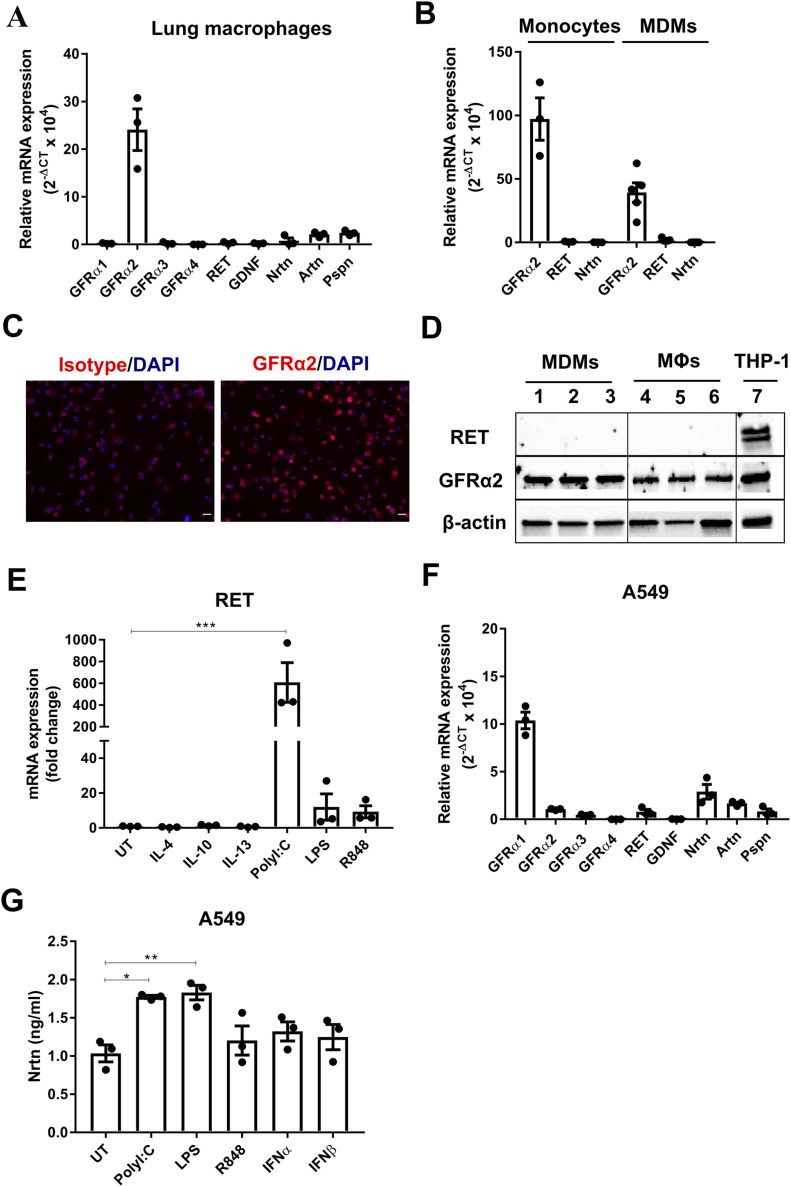
Figure 1. Human lung macrophages express GFRα2 and induce RET expression after TLR activation, whereas lung epithelial cells express the ligand NRTN.
(A) Relative mRNA expression (2−ΔCT × 104) of GDNF family receptors and ligands in human lung macrophages (n = 3). (B) Relative mRNA expression of GFRα2, RET, and NRTN in peripheral blood monocytes (n = 3) or MDMs (n = 6) from non-matched donors. (C) Representative images of GFRα2 expression in human lung macrophages by immunofluorescence (GFRα2 or isotype control [red] DAPI [blue]). Scale bar = 20 μM. (D) Representative Western blot of GFRα2 and RET protein expression in MDMs (lanes 1–3) (n = 3), human lung macrophages (MΦs) (lanes 4–6) (n = 3) and PMA-treated THP-1 macrophage positive control (lane 7); β-actin housekeeping control. (E) mRNA expression of RET in MDMs after stimulation with IL-4, IL-10, IL-13 (all 20 ng/ml), polyI:C (10 μg/ml), LPS, or R848 (both 100 ng/ml) for 24 h (n = 3) expressed as a fold change over the average expression of untreated (UT) cells. (F) Relative mRNA expression (2−ΔCT × 104) of GDNF family receptors and ligands in A549 cells (n = 3). (G) ELISA analysis of NRTN in A549 cells stimulated with polyI:C (10 μg/ml), LPS, R848 (both 100 ng/ml), IFNα or IFNβ (both 20 ng/ml) for 24 h (n = 3). Data information: Data are shown as mean ± SEM from three to six independent experiments. (E, G) *P < 0.05, **P < 0.01, ***P < 0.001; one-way ANOVA with Tukey’s post hoc test with multiple comparisons (E, G).
Source data are available for this figure.

