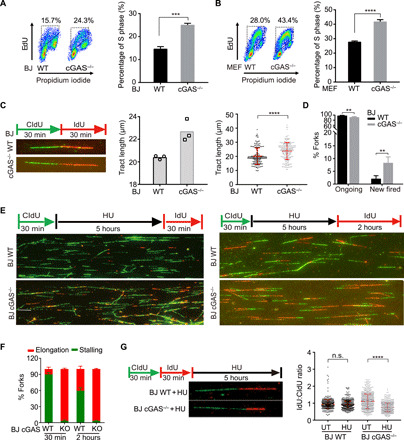
Fig. 2. cGAS deficiency endows a hyper-replicative cell state associated with replication defects.

(A and B) The staining of EdU and propidium iodide (PI) in BJ WT (A), MEF WT (B), and corresponding cGAS−/− cells was analyzed by flow cytometry. The percentage of S phase from flow cytometry analysis is shown. (C) Representative images of nascent DNA tract length in BJ WT and cGAS−/− cells (left), quantification of DNA tract length in either BJ WT or cGAS−/− cells from three independent experiments (middle), and nascent DNA tract length of one representative experiment (right) (n = 200, mean ± SD in each experiment). Statistical analysis was done with the two-sided Mann-Whitney test; ****P < 0.0001. (D) DNA fiber analysis of ongoing and new fired forks (n = 600) in BJ WT and cGAS−/− cells. Mean ± SD is shown. (E) The replication fork status of BJ WT and cGAS−/− cells treated with 4 mM HU for 5 hours and released for 30 min or 2 hours. Representative images of fiber assay are shown (scale bar, 10 μm). (F) DNA fiber analysis of replication fork stalling and elongation (n = 1800) in BJ WT and cGAS−/− cells treated with HU. Means and SD of three independent experiments are shown. (G) Ratios of IdU and CldU length (each group, n > 660) are shown in BJ WT and cGAS−/− cells treated with or without [untreated (UT)] 4 mM HU for 5 hours. Median ratio is indicated in red. **P < 0.01, ***P < 0.001, Mann-Whitney test. n.s., not significant.
