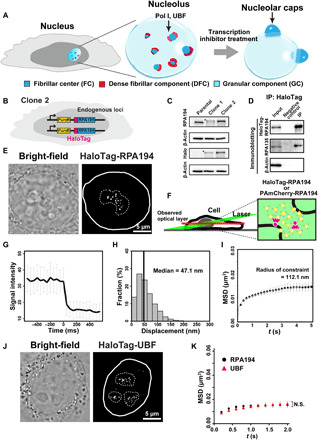
Fig. 1. Generation of cell lines expressing HaloTag-RPA194 or HaloTag-UBF and single-molecule imaging of HaloTag-RPA194 and HaloTag-UBF.

(A) Diagram of nucleolar reorganization in response to transcription inhibition. (B) Genome-edited HeLa cell line used for labeling Pol I molecules. (C) Immunoblotting of the parental HeLa cells, clones 1 (monoallelic tagging) and 2 (biallelic tagging) cell lysates with antibodies of RPA194, HaloTag, and β-actin. Asterisks indicate the position of HaloTag-RPA194. (D) Coimmunoprecipitation of RPA194-RPA135 in the Pol I complex from the clone 2 cell lysate. (E) Bright-field cell nucleus image (left) and oblique illumination microscopy image of HaloTag-RPA194 molecules (right) in a live HeLa cell. The nucleus and nucleolar area are indicated by white and dashed lines, respectively. (F) Left: Diagram of oblique illumination. Right: Sparse fluorescence labeling (red). (G) Single-step photobleaching of HaloTag-RPA194 dots. The vertical and horizontal axes represent the fluorescence intensities of the HaloTag-RPA194 dots and the tracking time series (the photobleaching point is set as time = 0; n = 35 cells), respectively. (H) Displacement (movement) distribution of HaloTag-RPA194 over 50 ms (n = 24 cells). (I) MSD plots of HaloTag-RPA194 molecules from 0.05 to 5 s (n = 24 cells). The data were fitted to a subdiffusive curve (gray line). Error bars indicate the 95% CI computed via bootstrap resampling. (J) Localization of TMR-HaloTag-UBF in the nucleolus. (K) MSD plots of HaloTag-UBF (red, n = 24 cells) and HaloTag-RPA194 (black, n = 24 cells) molecules with 95% CIs. N.S., not significant; P = 0.34 via bootstrapping for HaloTag-UBF versus HaloTag-RPA194.
