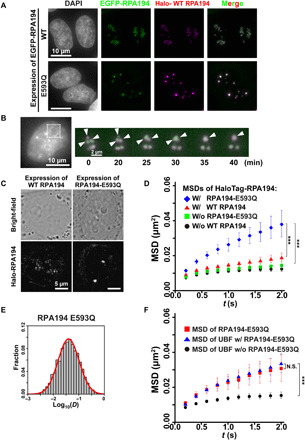
Fig. 4. Expression of mutant Pol I with RPA194-E593Q induces nucleolar cap structure formation.

(A) Localizations of HaloTag-RPA194 (magenta) and conditionally expressed EGFP-RPA194 (top, green) or EGFP-RPA194-E593Q (bottom, green) in cells fixed with formaldehyde. Note that HaloTag-RPA194 was fluorescently labeled with an excess amount of the HaloTag ligand TMR. (B) Time-lapse images of RPA194 foci in a cell expressing HaloTag-RPA194 (magenta) and EGFP-RPA194-E593Q (green). HaloTag-RPA194 was fluorescently labeled with an excess amount of the HaloTag ligand TMR. Left: Nucleolar regions were identified using Hoechst 33342 DNA staining in the same live cell. Right: Enlarged time-lapse images of the boxed region on the left. Arrows indicate individual RPA194 foci fusing. (C) Live-cell images of the localization of EGFP-RPA194. (D) MSD plots of HaloTag-RPA194 molecules before (black) and after induction of EGFP-RPA194 (WT, red), or before (green) and after induction of EGFP-RPA194-E593Q (E593Q, blue) with 95% CIs. For each condition, n = 23 to 26 cells. ***P < 0.0001 via bootstrapping for WT expression (red) versus E593Q expression (blue) (P = 6.8 × 10⁻⁵) and no expression of E593Q (green) versus E593Q expression (blue) (P = 8.0 × 10⁻⁶). (E) D distribution of PAmCherry-RPA194-E593Q (n = 30 cells) with a logarithmic scale (for details, see Materials and Methods), which was fitted to a single Gaussian distribution (red). (F) MSD plots of HaloTag-UBF molecules before (black) and after induction of EGFP-RPA194 (blue) with 95% CIs. For each condition, n = 40 to 45 cells. For comparison, the MSD plot of HaloTag-RPA194-E593Q (red) was reproduced from Fig. 3C. ***P < 0.0001 via bootstrapping for UBF (black) versus UBF with RPA194-E593Q (blue) (P = 1.0 × 10⁻⁶). P = 0.29 for UBF with RPA194-E593Q versus RPA194-E593Q.
