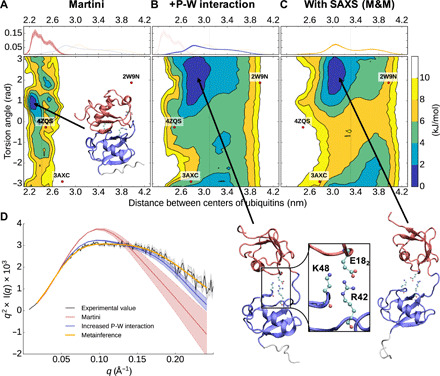
Fig. 2. Characterization of the dynamics of linear diubiquitin.

(A to C) Free energy landscapes (in kilojoules per mole) as a function of the distance between the center of mass of the two ubiquitin domains and their relative orientation (measured as the torsion angle between two axes defined using the first and second half of the sequence of each ubiquitin; see Methods). The dots represent the coordinates associated with the available diubiquitin crystal structures. On top is shown the probability distribution of the distance between the centers of the two ubiquitin domains. (D) Experimental and from-simulation calculated Kratky plot. The shaded area represents the error range.
