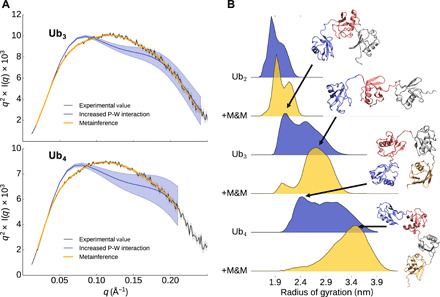
Fig. 3. Characterization of the dynamics of linear tri- and tetraubiquitin.

(A) Experimental and from-simulations calculated Kratky plot for tri- and tetraubiquitin. The shaded area represents the error range. (B) Distribution of the radius of gyration from the ensembles with and without M&M.
