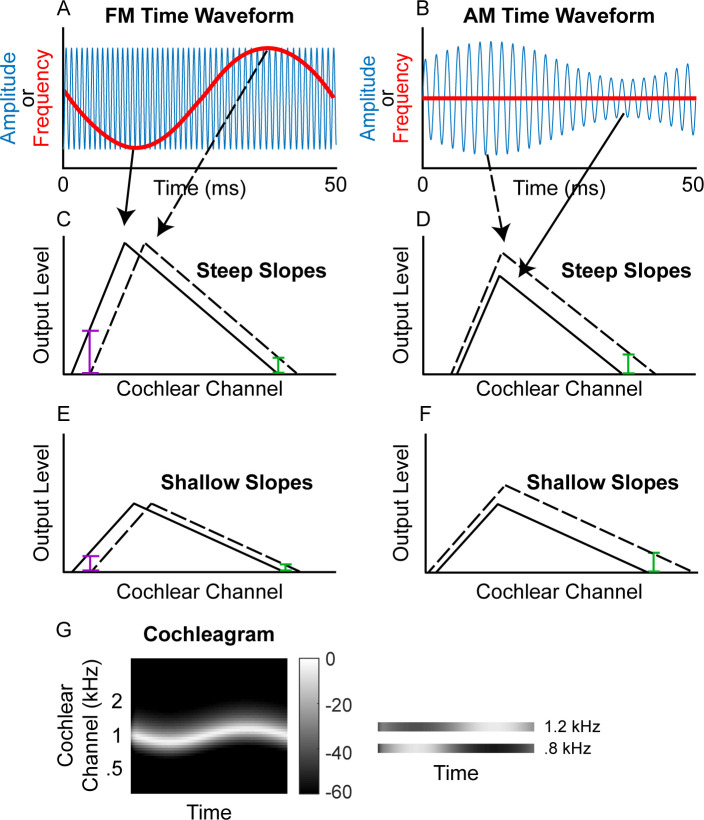
Figure 1. Schematic of (A) FM and (B) AM time waveforms (fc = 1 kHz; fm = 20 Hz) and the resulting changes in basilar-membrane excitation for steep (C and D) and shallow (E and F) slopes.
In A and B, the blue time waveforms represent amplitude over time, while the superimposed red waveforms are the same stimuli plotted in terms of instantaneous frequency over time. Panels C and E demonstrate that a place code for FM would result in a greater change in output level on the low-frequency side of the excitation pattern (purple bars) relative to the high-frequency side (green bars) and that shallower filter slopes result in poorer FM coding (larger colored bars in C than in E) but not poorer AM coding (same size colored bars in D and F). (G) Schematic cochleagram of an FM tone, showing how the output from two separate cochlear channels (right) with center frequencies on either side of the carrier frequency is AM that is out of phase.

