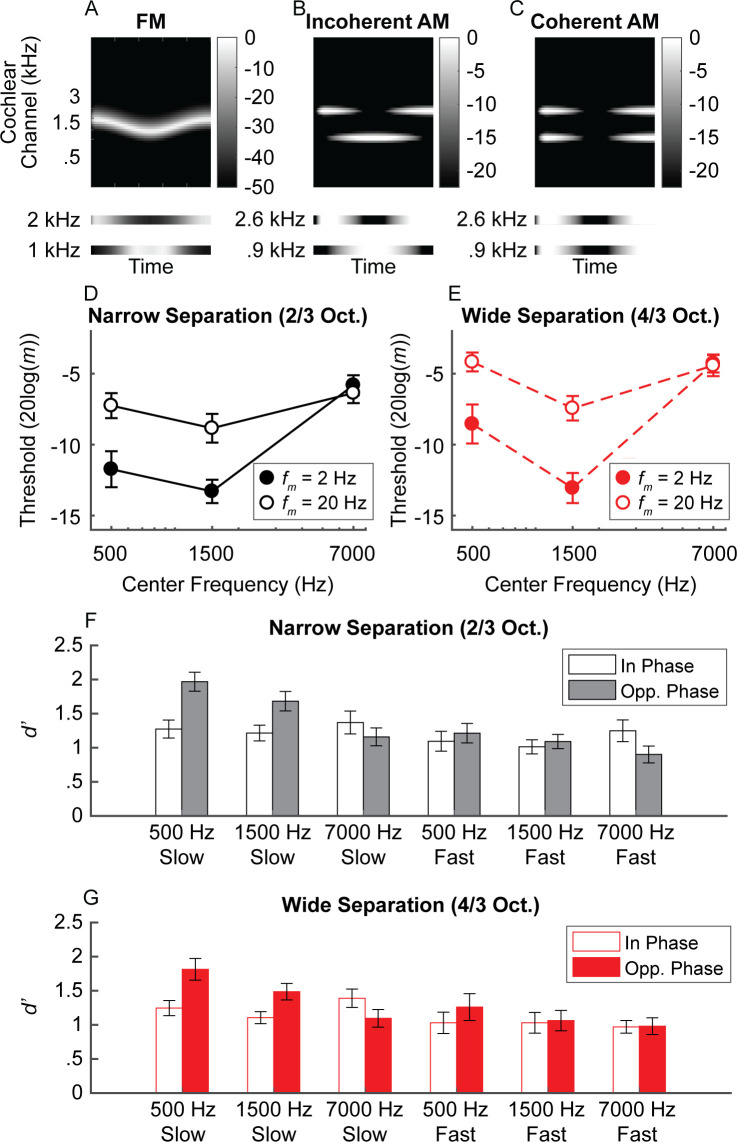
Figure 6. Experiment 2 schematic cochleagram and results.
(A) Schematic cochleagram of an FM tone. The magnitude responses for two off-frequency filters (bottom) are 180-degrees out of phase for any given snapshot in time. (B and C) The schematic cochleagrams of two-component AM dyads with envelopes that are in opposite phase (incoherent) versus in phase (coherent). Incoherent envelopes lead to rate-place fluctuations similar to that observed in FM. (D and E) Average sensitivity for discriminating incoherent AM at slow (filled circles) and fast (open circles) rates in the narrow (black) and wide (red) frequency separation conditions. Sensitivity for simulated FM is best at lower center frequencies and slow rates, with slightly higher thresholds at very low center frequencies, similar to traditional FM sensitivity (Sek and Moore, 1995). (F and G) Sensitivity for detecting in-phase (open bars) and opposite-phase (filled bars) AM for two-component dyads. Sensitivity for opposite-phase AM (i.e., simulated FM) is only boosted for low center frequencies at slow rates, meaning a unified neural place code can account for limits in human FM sensitivity. N = 20 in all measures. Error bars represent ±1 standard error of the mean.

