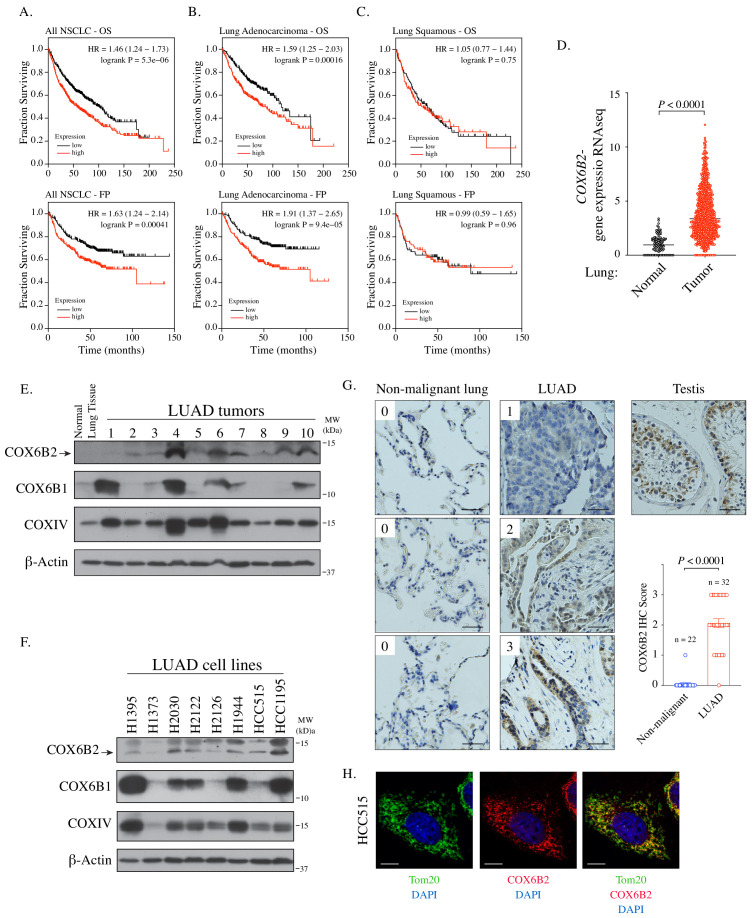
Figure 1. COX6B2 mRNA expression correlates with poor outcome in LUAD.
(A–C) Kaplan-Meier curves for OS and FP in NSCLC (A) LUAD (B) and LUSC patients (C). (D) COX6B2 mRNA expression (RNA-seq RSEM, log2(norm count +1)) from TCGA Lung Cancer dataset. Bars represent median (normal: n = 110; tumor: n = 1017). P values calculated by Mann-Whitney test. (E–F) Whole tissue homogenates of LUAD tumors (E) and LUAD cell line lysates (F) were immunoblotted with indicated antibodies. Molecular weight (MW) markers are indicated. (G) IHC staining of non-malignant testis (a positive control), non-malignant lung (adjacent normal) and LUAD tissues. Scores ranged from 0 to 3. Scale bar, 50 μm. Bars represent mean ± SEM. p-Values calculated by Mann-Whitney test. (H) Representative confocal images of endogenous COX6B2 in HCC515 cells. Tom20 is used as a mitochondrial marker. Images were shown as Z-stack maximum projection from 0.3-μm-thick image. Scale bar, 10 μm.


