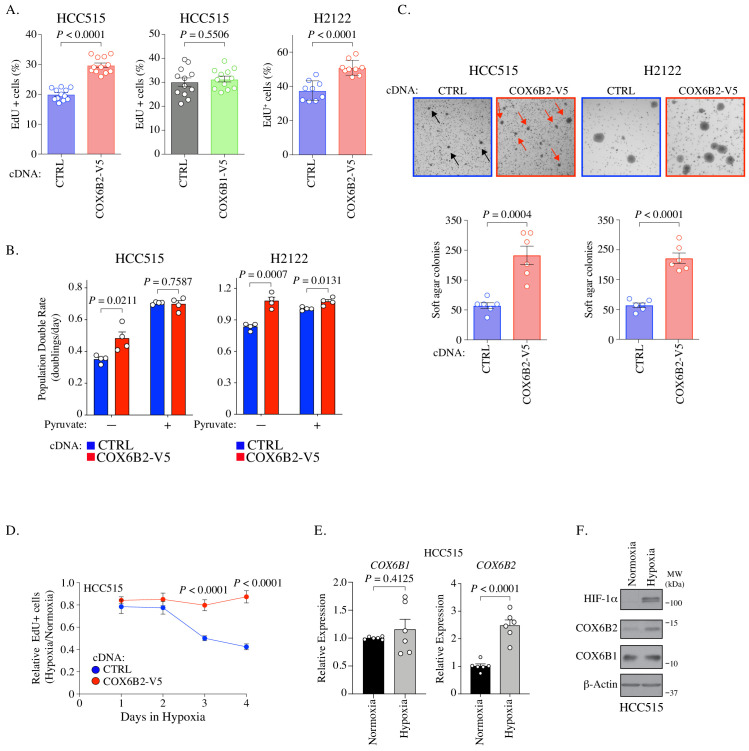
Figure 4. COX6B2 promotes cell division.
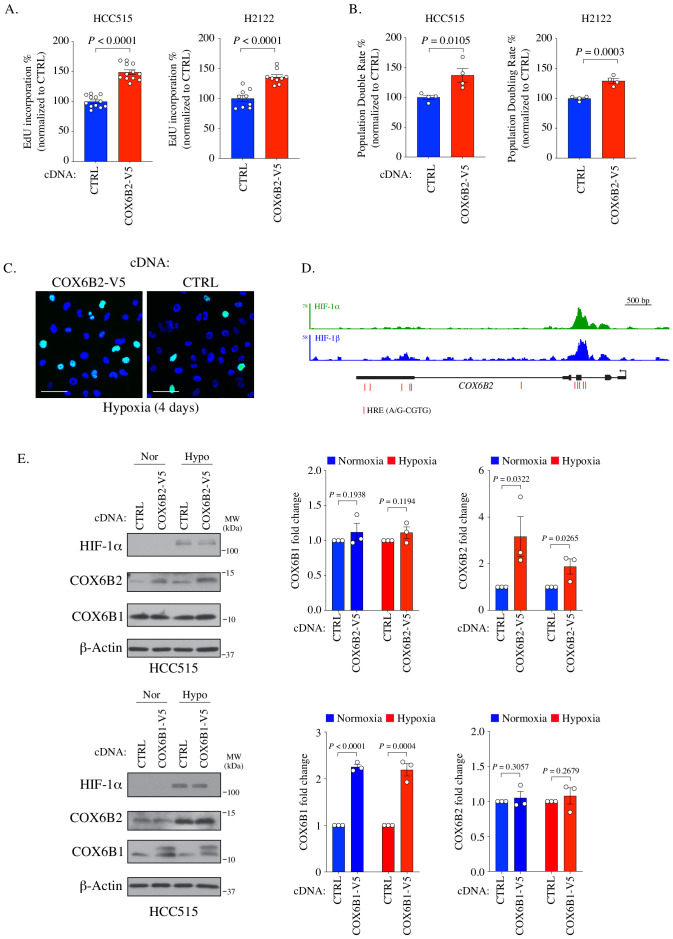
(A) Percentage of cells positive for EdU incorporation in indicated samples. Values represent the mean ± SEM (n ≥ 9). p-Value calculated by Student’s t-test. (B) Population doubling rate in indicated samples incubated ±1 mM pyruvate for 5 days. Bars represent mean + SEM (n = 4). p-Value calculated by Student’s t-test. (C) Top: Representative images of soft agar assays for indicated cell lines. Arrows indicate formed colonies. Bottom: Graphs represent mean colony numbers in indicated cell lines. Bars represent mean ± SEM (n = 6). p-Value calculated by Student’s t-test. (D) EdU-positive HCC515 cells at indicated times in hypoxia. Values are relative to cells incubated in normoxia. Bars represent mean ± SEM (n = 8). p-Value calculated by Student’s t-test. (E) Average mRNA expression of COX6B1 and COX6B2 measured following 12 hr of hypoxia culture in HCC515 cells. Bars represent mean ± SEM (n = 6). P calculated by Student’s t-test. (F) Whole cell lysates from indicated cell lines were immunoblotted with indicated antibodies. Hypoxia exposure was for 12 hr. Representative immunoblots from n = 3. MW markers are indicated.


