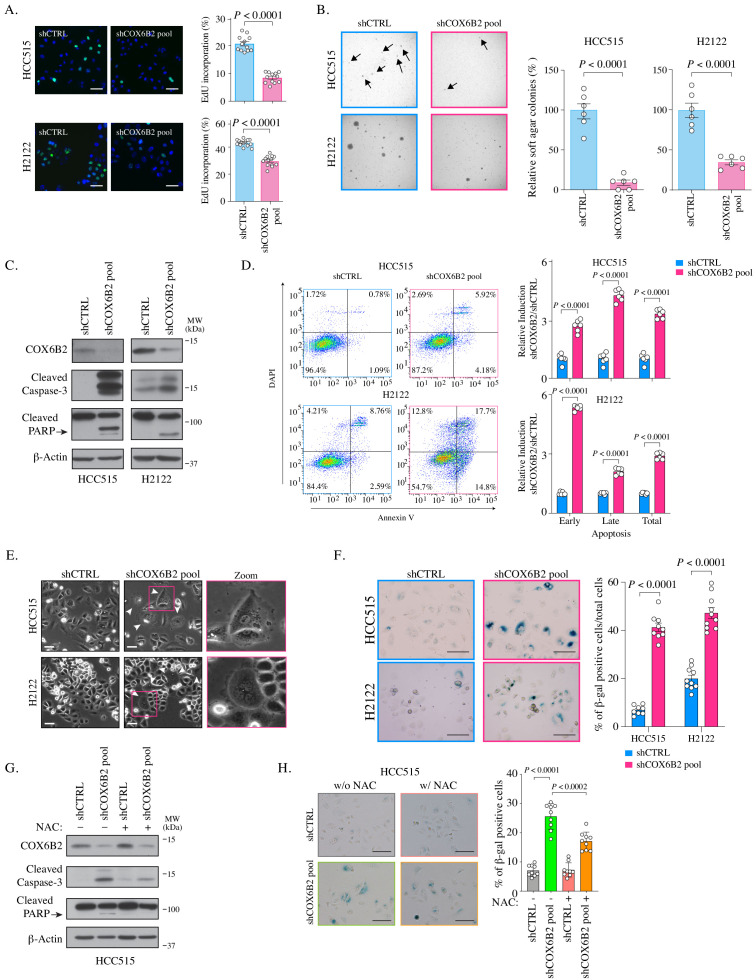
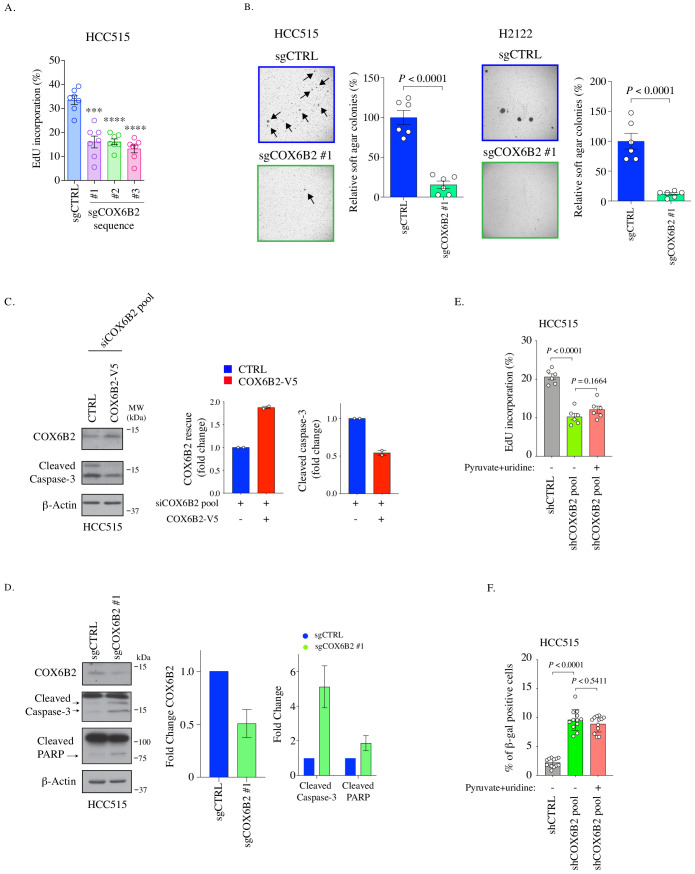
Figure 6. COX6B2 is essential for tumor cell viability and survival.
(A) Left: Representative images of EdU staining in indicated cell lines. (EdU, green; Hoechst, blue). Scale bar, 100 μm. Right: Quantitation of EdU-positive cells. Bars represent the mean ± SEM (n ≥ 12). p-Value calculated by Student’s t-test. (B) Left: Representative images of colonies in soft agar. Arrows indicate formed colonies. Right: Bars represent relative mean colony numbers ± SEM (n = 6). p-Value calculated by Student’s t-test. (C) Representative immunoblots of whole cell lysates of indicated cells blotted with indicated antibodies. MW markers are indicated. (D) Left: Representative scatter plots of Annexin V staining in indicated cell lines. Bars represent mean fold change + SEM (n = 6). p Calculated by Student’s t-test. (E) Representative phase contrast images of indicated cell lines. Arrowheads indicate the flattened senescence morphology with vacuole accumulation and multinucleation. Scale bar, 100 μm. (F) Representative images of senescence-associated- β-galactosidase staining in indicated cells. Scale bar, 100 μm. Bars represent mean ± SEM (n ≥ 8). p Calculated by Student’s t-test. (G) Whole cell lysates from indicated cell lines were cultured with or without NAC (5 mM) for 7 days were immunoblotted with indicated antibodies. MW markers are indicated. (H) Representative images of senescence-associated- β-galactosidase staining in indicated cell lines cultured with or without NAC (5 mM) for all 11 days. Scale bar, 100 μm. Bars represent mean ± SEM (n = 9). p Calculated by Student’s t-test.


