. 2020 Sep 10;9:e52253. doi: 10.7554/eLife.52253

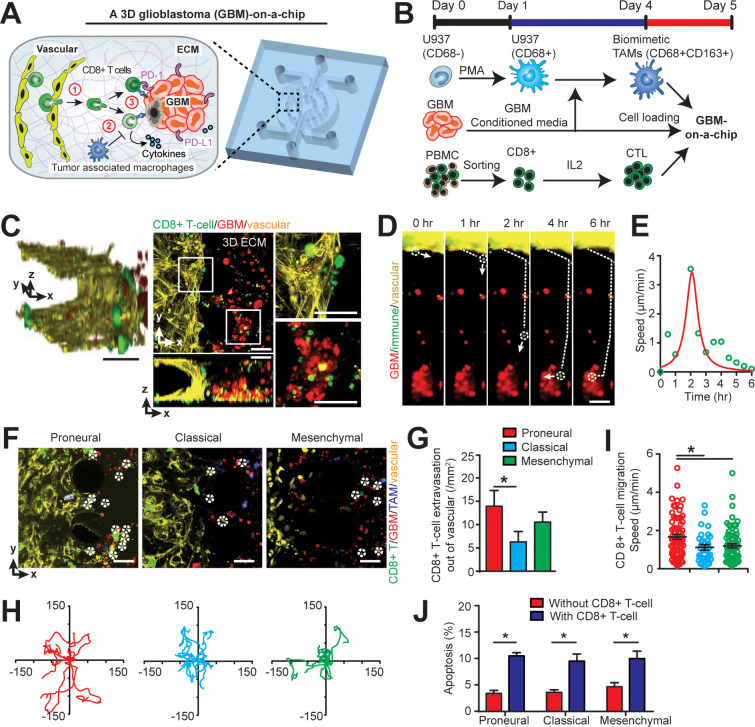
Figure 2. Modelling the in vivo GBM tumor niche in a ‘GBM-a-on-Chip’ microphysiological system.

(A) A schematic diagram illustrating a microfluidics-based GBM-on-a-Chip model to investigate ① the interactions of immune cell (CD8+ T-cells) with brain microvessels, ② tumor-associated macrophages (TAMs) and ③ GBM tumor cells in an engineered 3D brain-mimicking ECM. (B) A schematic illustrating the procedures of cell preparation in the microphysiological system. Biomimetic TAMs (CD68+CD163+) were prepared by differentiating monocyte-like U937 cells with 5 nM of PMA for 24 hr, followed by treatments of conditioned-media of GBM cells for 3 days. Simultaneously, fresh allogeneic CD8+ T-cells were isolated from PBMCs and activated and expanded for 3 days with IL-2. (C) Representative confocal immunofluorescence images showing a 3D brain microvessel lumen (yellow) in contact with CD8+ T-cells (green) and GBM (PN, GBML20) tumor cells (red). Scale bar is 50 µm. (D) Representative time-lapsed images showing a single CD8+ T-cell extravasating through brain microvessels (yellow, 0–1 hr), infiltrating through ECM (1–4 hr), and interacting with GBM tumor cells (red, 4–6 hr). Scale bar is 50 µm. (E) Quantified CD8+ T-cell migration speed at different time points of infiltration, indicating the relatively maximum migration speed after extravasation and before contacting with GBM cells. (F) Representative immunofluorescence images showing the distinct counts of allogeneic CD8+ T-cell infiltrate in the PN (GBML20), CL (GBML08) and MES (GBML91) GBM subtypes in GBM-on-a-Chip after 3 days’ culture. Note that CD8+ T-cells (green) were in contact with brain microvessels (yellow), TAMs (blue) and GBM tumor cells (red). Scale bar is 50 µm. (G) Quantified results showing more infiltrated allogeneic CD8+ T-cells in the PN GBM as compared to the CL and MES GBMs. (H) Migration trajectories of infiltrated CD8+ T-cell (n > 20) for 2 hr in different GBM subtypes. (I) Quantified migration speed of infiltrated CD8+ T-cell, showing faster migration speed in the PN GBM as compared to the CL and MES GBMs at the observation window. Note that the speed range (0–6 µm/min) represents different infiltration stages of different T-cells. (J) Quantified GBM cell apoptosis ratio with the presence or absence of IL-2-activated allogeneic CD8+ T-cell in different GBM niches based on caspase-3/7 activation. Error bars represent ± standard error of the mean (s.e.m.). p-Values were calculated using the Student’s paired sample t-test. *, p<0.05.

Figure 2.

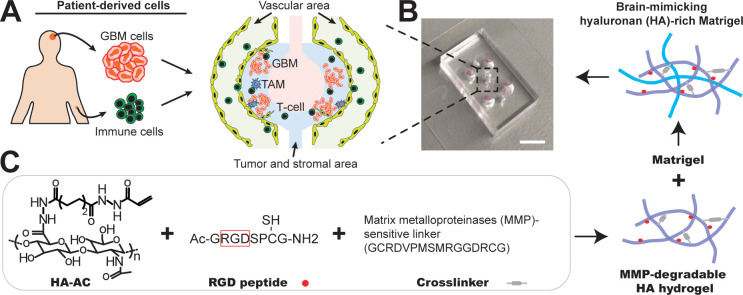
Figure 2—figure supplement 1. Microfabrication of the microfluidics-based ‘GBM-on-a-Chip’ microphysiological system.

Figure 2—figure supplement 1.

(A) A schematic illustrating the layout of ex vivo microphysiological system populated by using patient-resected tumor cells and human primary immune cells. The system consists of peripheral regions (yellow) for brain vascular growth, and immune cell seeding, middle regions (blue) for tumor and stromal TAMs growth, and center region (pink) for cell culture medium infusion. (B) A photo showing the actual microfluidic chip. Scale bar is 5 mm. (C) A schematic demonstrating the synthesis of brain-mimicking HA-rich Matrigel ECM. RGD peptides are conjugated onto Acrylated hyaluronic acid (HA-AC) and crosslinked with MMP-degradable crosslinker (GCRDVPMSMRGGDRCG). To further mimic the tumor microenvironment growth-factor-reduced Matrigel matrix is interpenetrated with MMP-degradable HA hydrogel for brain tissue-mimicking ECM.
Figure 2—figure supplement 2. Sample preparation for TAMs and effector CD8+ T-cells.
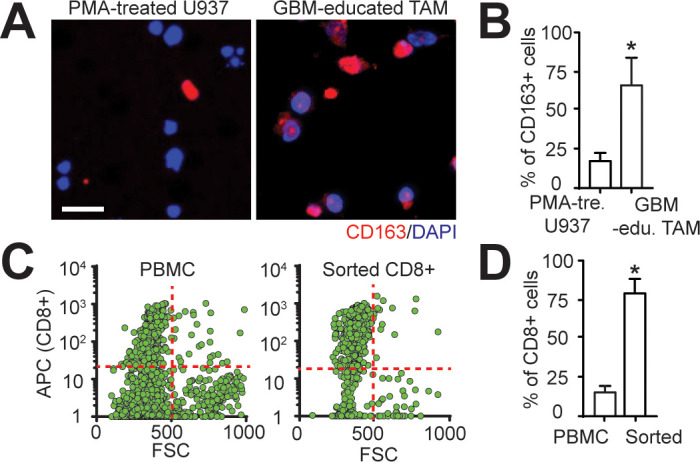
Figure 2—figure supplement 2.

(A) Representative immunofluorescence images showing CD163 expressions on PMA-treated U937 monocytes with and without treatments of GBML91’s conditioned-media. Scale bar is 50 µm. (B) Quantified results showing more CD163+ macrophages in GBML91-educated U937 cells. (C) Quantified flow results showing the purity of sorted CD8+ T-cells from PBMCs. APC represented the fluorescent intensity of CD8+ markers. (D) Quantified results showing the purity of sorted CD8+ T-cells is ~80%. p-Values were calculated using the unpaired two-tailed Student’s t-test. *, p<0.05.
Figure 2—figure supplement 3. CD8+ T-cell extravasation and infiltration behaviors in the engineered GBM microenvironment without the presence of TAM.
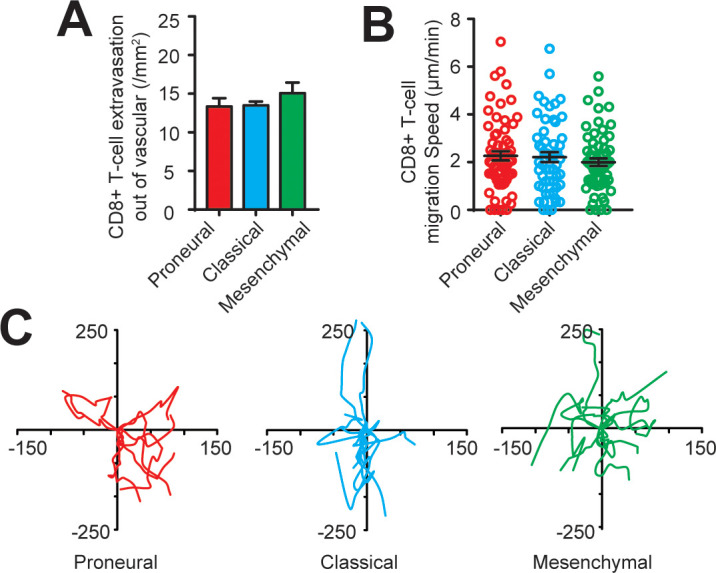
Figure 2—figure supplement 3.

(A) Quantified results showing similar amounts of extravasated CD8+ T-cells out of vascular in the PN (GBML20), CL (GBML08) and MES (GBML91) GBMs without the presence of TAM. (B) Quantified results showing the migration speeds of infiltrated CD8+ T-cells in all three GBM subtypes without the presence of TAM are comparable. (C) Representative trajectories of infiltrated CD8+ T-cells in the 2 hr observation window in different GBM subtypes without the presence of TAM. Error bars represent ± s.e.m.
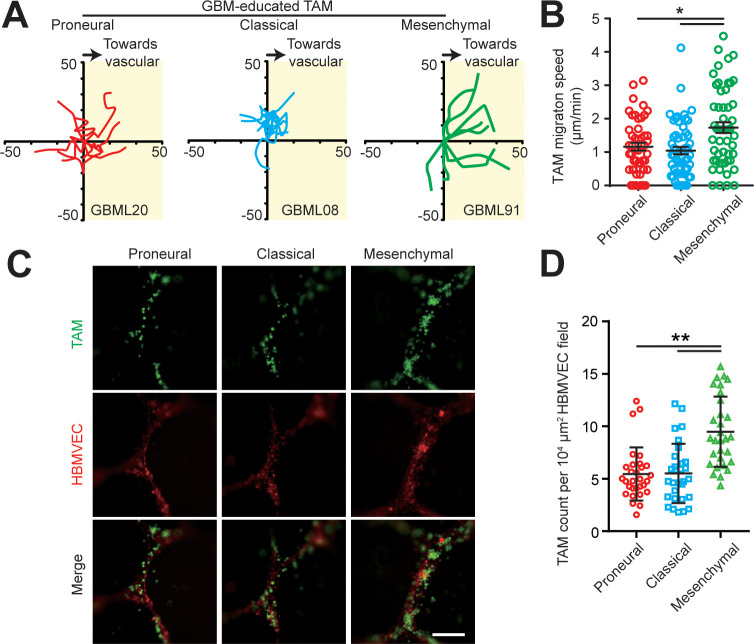
Figure 2—figure supplement 4. TAM motility and adherent behaviors in the engineered tumor microenvironments of different GBM subtypes.

Figure 2—figure supplement 4.

(A) Representative trajectories of embedded TAM movements in a 2 hr observation window in different GBM subtypes. (B) Quantified results showing faster TAM movement towards the vascular side in the MES (GBML91) GBM as compared to the CL (GBML08) and PN (GBML20) GBMs. Error bars represent ± s.e.m. p-Values were calculated using one-way ANOVA. *, p<0.05. (C) Representative staining images showing different subtypes of GBM-educated TAMs adherent to HBMVECs. TAMs were plated into 24-well plate with HBMVEC monolayer and cultured for 12 hr, followed by 3 times washing with warm media. Scale bar is 200 µm. (D) Number of adherent TAMs to HBMVEC were counted and plotted as cell number per 104 μm2 HBMVEC field. p-Values were calculated using unpaired two-tailed Student’s t-test, N = 30, **p<0.01.