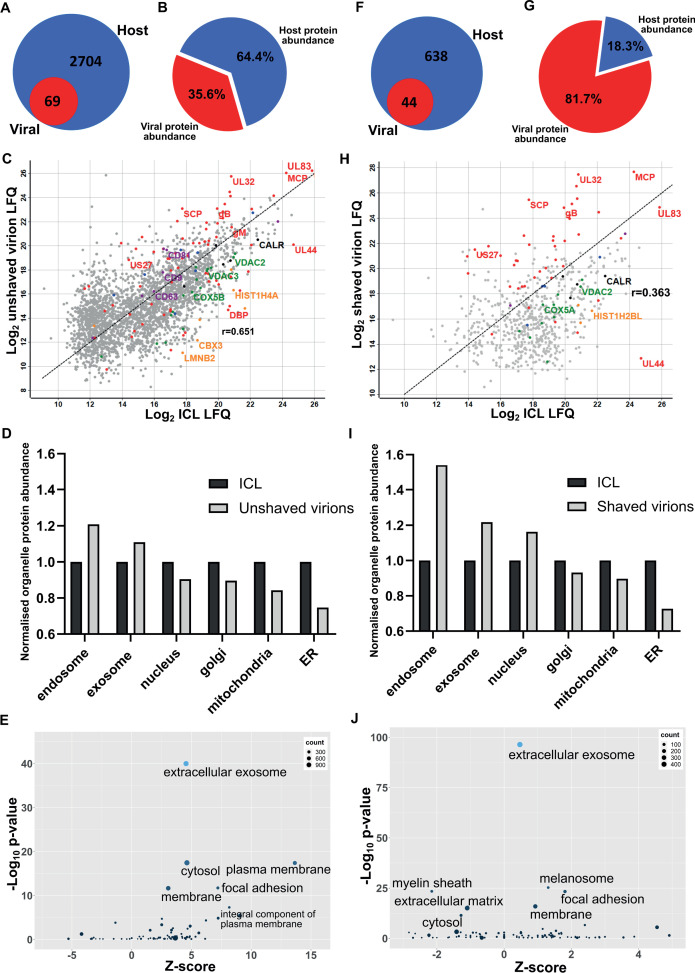
Figure 1. Proteomic analysis reveals HCMV virions are significantly enriched with host exosome proteins.
(A) Total number of host and viral proteins identified in the virion by mass spectrometry. (B) Abundance proportions of host and viral proteins in the virion, as determined by MaxQuant label-free quantitation (LFQ). (C) Scatter plot of unshaved virion proteins versus HCMV infected cellular lysate (ICL), 5 DPI, MOI = 3. Red: HCMV proteins, green: select mitochondrial marker proteins, orange: nuclear markers, black: endoplasmic reticulum markers, blue: endosome markers, purple: exosome markers. Equation of line: y = x, r = 0.651. (D) Relative abundance of various host organelles in ICL compared to virions purified from infected cell culture supernatant. Total organelle abundance was calculated by summing individual protein abundance. (E) Gene ontology (cellular component) enrichment analysis of unshaved virions compared to ICL background. Analysis was performed using DAVID Functional Annotation and results plotted with GOPlot. (F) Number of host and viral proteins identified in the virion following proteinase K surface shaving. (G) Abundance proportions of host and viral proteins in surface shaved virions. (H) Scatter plot of all proteinase K shaved virion proteins versus HCMV ICL. Red: HCMV proteins, green: select mitochondrial marker proteins, orange: nuclear markers, black: endoplasmic reticulum markers, blue: endosome markers, purple: exosome markers. Equation of line: y = x, r = 0.363. (I) Relative abundance of various host organelles in ICL compared to proteinase K-shaved HCMV virions. (J) Gene ontology (cellular component) enrichment analysis of proteinase K shaved virions compared to ICL background. Performed with DAVID as for (E).


